The goal of childdevdata is to support innovation in child development. The package
- Makes anonymous microdata available to the research community;
- Adopts a simple naming schema for developmental milestones;
- Supports multiple measurement instruments;
- Eases joint analyses of the data.
The current version bundles milestone data from ten studies, containing 1,116,061 assessments made on 10,831 unique children during 28,465 visits, covering 21 different instruments.
Installation
You can install the released version of childdevdata from CRAN with
install.packages("childdevdata")You can install the development version of childdevdata from GitHub with
install.packages("remotes")
remotes::install_github("d-score/childdevdata")
Example
The following example visualises how the proportion of toddlers that are able to walk increases with age.
library(childdevdata)
library(ggplot2)

# we use the Dutch SMOCC data
data <- with(gcdg_nld_smocc,
             data.frame(age = round(agedays/365.25, 4),
                        walk = ddigmd068))
ggplot(na.omit(data), aes(age, walk)) +
  geom_point(cex = 0.5) +
  geom_smooth(method = "gam", formula = y ~ s(x, bs = "cs"),
              se = FALSE, lwd = 0.5) +
  theme_bw()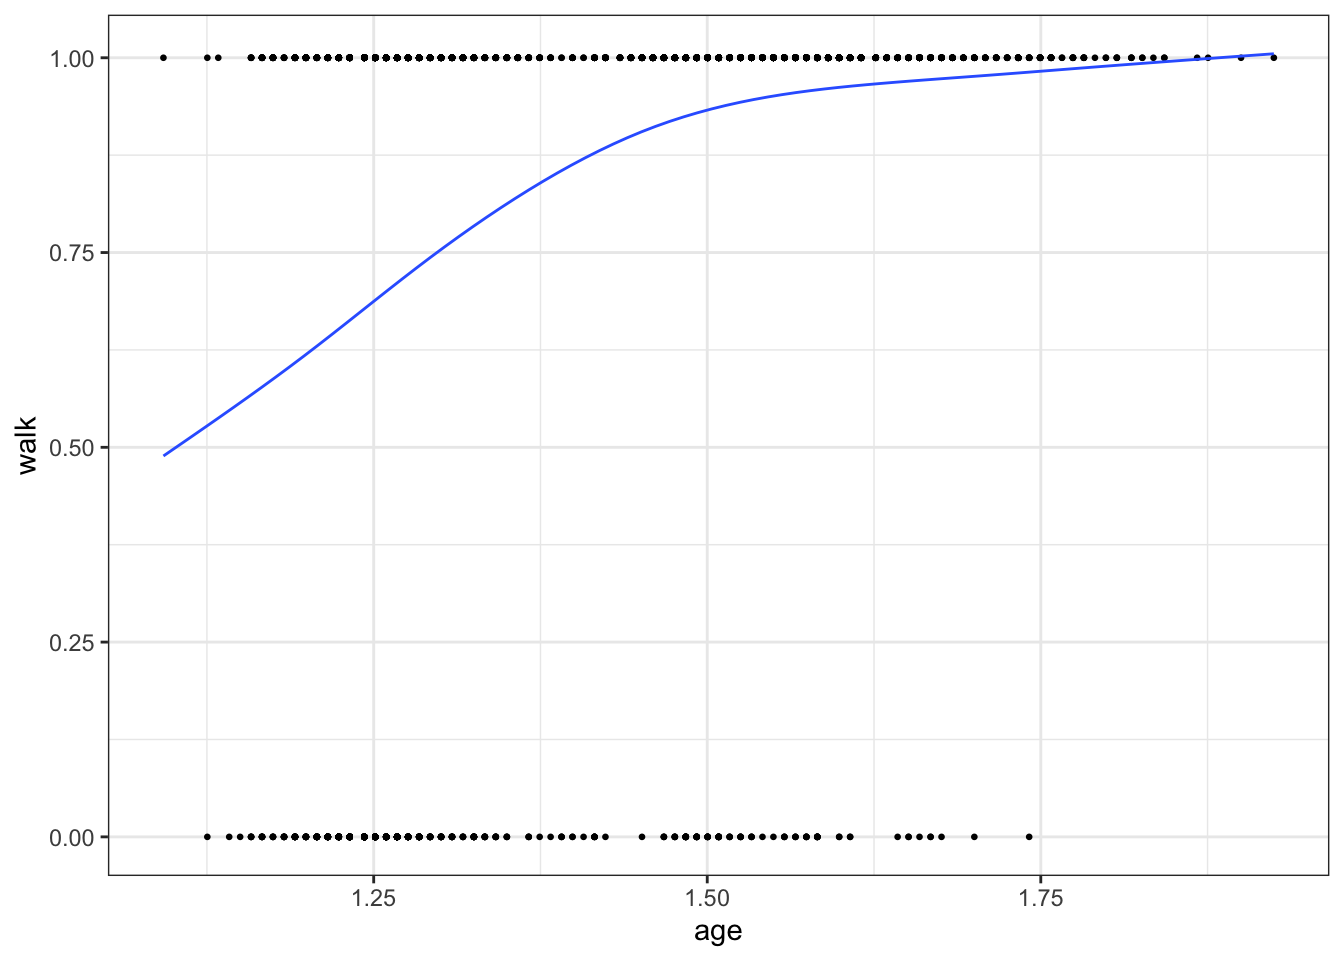
Overview of available dataset and documentation
The package contains multiple datasets. Obtain the list of datasets by
data(package = "childdevdata")$results[, "Item"]
#>  [1] "gcdg_chl_1"       "gcdg_chn"         "gcdg_col_lt42m"   "gcdg_col_lt45m"
#>  [5] "gcdg_ecu"         "gcdg_jam_lbw"     "gcdg_jam_stunted" "gcdg_mdg"
#>  [9] "gcdg_nld_smocc"   "gcdg_zaf"
The documentation of the data can be found by typing into the console:
?gcdg_col_lt42mThe size of the data is
dim(gcdg_col_lt42m)
#> [1] 1311  627
The first six rows and first nine columns are
head(gcdg_col_lt42m[, 1:9])
#> # A tibble: 6 × 9
#>   ctrycd cohort        cohortn subjid agedays sex   gagebrth aqicmc010 aqicmc013
#>   <chr>  <chr>           <int>  <int>   <int> <chr>    <int>     <int>     <int>
#> 1 COL    GCDG-COL-LT4…      50 5.00e6     660 Fema…      224        NA        NA
#> 2 COL    GCDG-COL-LT4…      50 5.00e6    1166 Fema…      280        NA        NA
#> 3 COL    GCDG-COL-LT4…      50 5.00e6     314 Fema…      273        NA        NA
#> 4 COL    GCDG-COL-LT4…      50 5.00e6    1239 Fema…      259        NA        NA
#> 5 COL    GCDG-COL-LT4…      50 5.00e6     679 Fema…      224        NA        NA
#> 6 COL    GCDG-COL-LT4…      50 5.00e6    1074 Fema…      252        NA        NA
The first seven columns are administrative and background variables. Column numbers eight and up hold the milestone scores.
Combining data
Concatenating two or more data is straightforward using dplyr. The following code concatenates all publicly available GCDG datasets.
library(dplyr)
#>
#> Attaching package: 'dplyr'
#> The following objects are masked from 'package:stats':
#>
#>     filter, lag
#> The following objects are masked from 'package:base':
#>
#>     intersect, setdiff, setequal, union
alldata <- bind_rows(gcdg_chl_1, gcdg_chn, gcdg_col_lt42m, gcdg_col_lt45m, gcdg_ecu,
                     gcdg_jam_lbw, gcdg_jam_stunted, gcdg_mdg, gcdg_nld_smocc, gcdg_zaf)
dim(alldata)
#> [1] 28465  1306
Both the number of rows and the number of columns have increased. Milestones not appearing in a particular data obtain all missing (NA) scores.
The number of records per cohort by sex is
table(alldata$cohort, alldata$sex)
#>
#>                    Female Male
#>   GCDG-CHL-1          970 1169
#>   GCDG-CHN            509  481
#>   GCDG-COL-LT42M      646  665
#>   GCDG-COL-LT45M      651  684
#>   GCDG-ECU            337  330
#>   GCDG-JAM-LBW        242  201
#>   GCDG-JAM-STUNTED    207  270
#>   GCDG-MDG            113   92
#>   GCDG-NLD-SMOCC     8499 8223
#>   GCDG-ZAF           2154 2018
Calculating D-score and DAZ
The dscore package calculates the D-score (van Buuren 2014) and the D-score adjusted for age Z-score (DAZ) for all cases:
library(dscore)
alldata$age <- round(alldata$agedays/365.25, 4)
d <- dscore(alldata)
head(d)
#>       a  n     p    d   sem   daz
#> 1 1.024 29 0.690 51.8 0.852 0.947
#> 2 1.509 22 0.955 59.5 1.296 0.556
#> 3 0.975 29 0.724 52.5 0.875 1.484
#> 4 1.016 29 0.759 53.3 0.875 1.432
#> 5 1.016 22 0.682 49.7 0.810 0.396
#> 6 1.517 25 0.840 59.5 1.274 0.516
dim(d)
#> [1] 28465     6
We visualise the D-score distribution by age per cohort as
alldata <- bind_cols(alldata, d)
ggplot(alldata, aes(age, d, group = cohort)) +
  geom_point(cex = 0.3) +
  facet_wrap(~ cohort) +
  ylab("D-score") + xlab("Age (years)") +
  theme_bw()
#> Warning: Removed 380 rows containing missing values (`geom_point()`).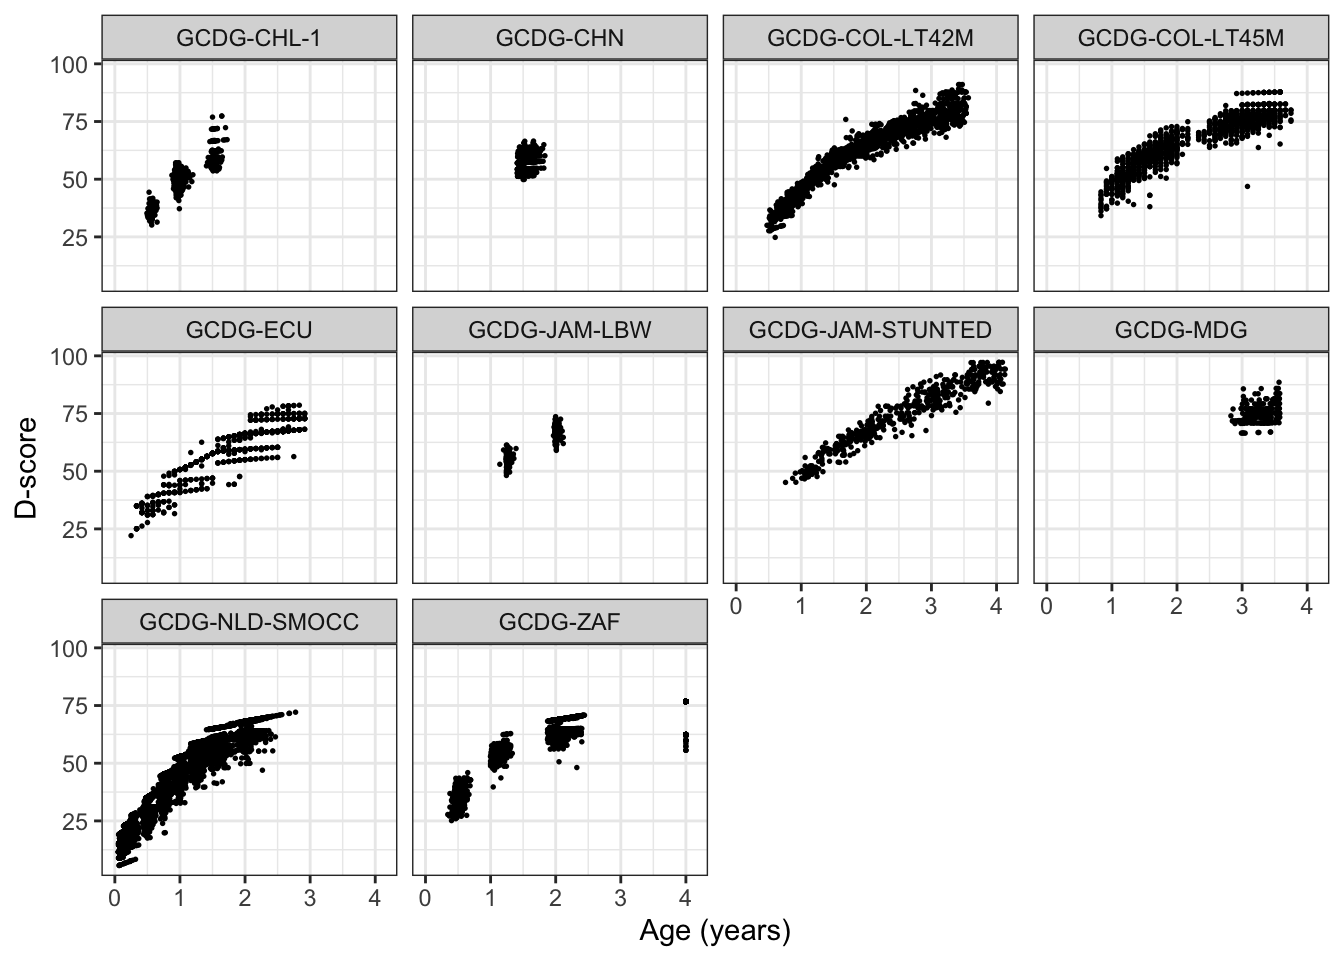
Why this package?
We all want our children to grow and prosper. While there is no shortage of apps and instruments to track child development, it is often unclear which data went into the construction of these tools. In order to improve measurement and norm setting of child development, we need child-level response data per milestone and age. However, no such public dataset seem to exist. The childdevdata package fills that void.
The package grew out of a project in which we collected milestone data from 16 cohorts. See Weber et al. (2019) and http://d-score.org/dbook2/ for results. Ten cohort owners graciously decided to make their data available for third parties. We are grateful to them.
How to use the data?
Tremendous effort has gone into the collection and harmonisation of the data. You can use the data in this package under the CC BY 4.0 license. Basically, this means that you may share and adapt the data, on the condition that you give appropriate credit and clearly indicate any changes you’ve made. See the license text for details.
We expect that you will properly cite the source data when you use the data in your own product or publication, as follows:
- If you use one dataset, please cite the publication(s) given in the documentation of that dataset.
- If you use two or more datasets, cite the publication(s) for each dataset and cite the
childdevdatapackage.
The citation of the childevdata data package is
@software{stef_van_buuren_2021_4700229,
  author       = {Stef van Buuren and
                  Iris Eekhout and
                  Marta Rubio Codina and
                  Orazio Attanasio and
                  Costas Meghir and
                  Emla Fitzsimons and
                  Sally Grantham-McGregor and
                  Maria Caridad Araujo and
                  Susan Walker and
                  Susan Chang and
                  Christine Powell and
                  Ann Weber and
                  Lia Fernald and
                  Paul Verkerk and
                  Linda Richter and
                  Betsy Lozoff},
  title        = {D-score/childdevdata: childdevdata 1.1.0},
  month        = apr,
  year         = 2021,
  publisher    = {Zenodo},
  version      = {v1.1.0},
  doi          = {10.5281/zenodo.4700229},
  url          = {https://doi.org/10.5281/zenodo.4700229}
}
Want to contribute?
Do you have similar data and want to help others to advance the field? Please let us know. We hope that the childdevdata package may continue to grow into a valuable resource for developers and researchers worldwide.
Acknowledgement
This study was supported by the Bill & Melinda Gates Foundation. The contents are the sole responsibility of the authors and may not necessarily represent the official views of the Bill & Melinda Gates Foundation or other agencies that may have supported the primary data studies used in the present study.