3.3 Age profile of item mappings
Another way to explore the similarity of milestones from different instruments is to plot the probability of passing by age. Figure 3.2 shows two examples. The first graph presents the age curves of a group of four cognitive items for assessing the ability to put a cube or block in a cup or box. The milestones are administered in different studies and seem to work similarly. The second plot shows a similar graph for items that assess the ability to build a tower of six cubes or blocks. These milestones have similar age patterns as well.
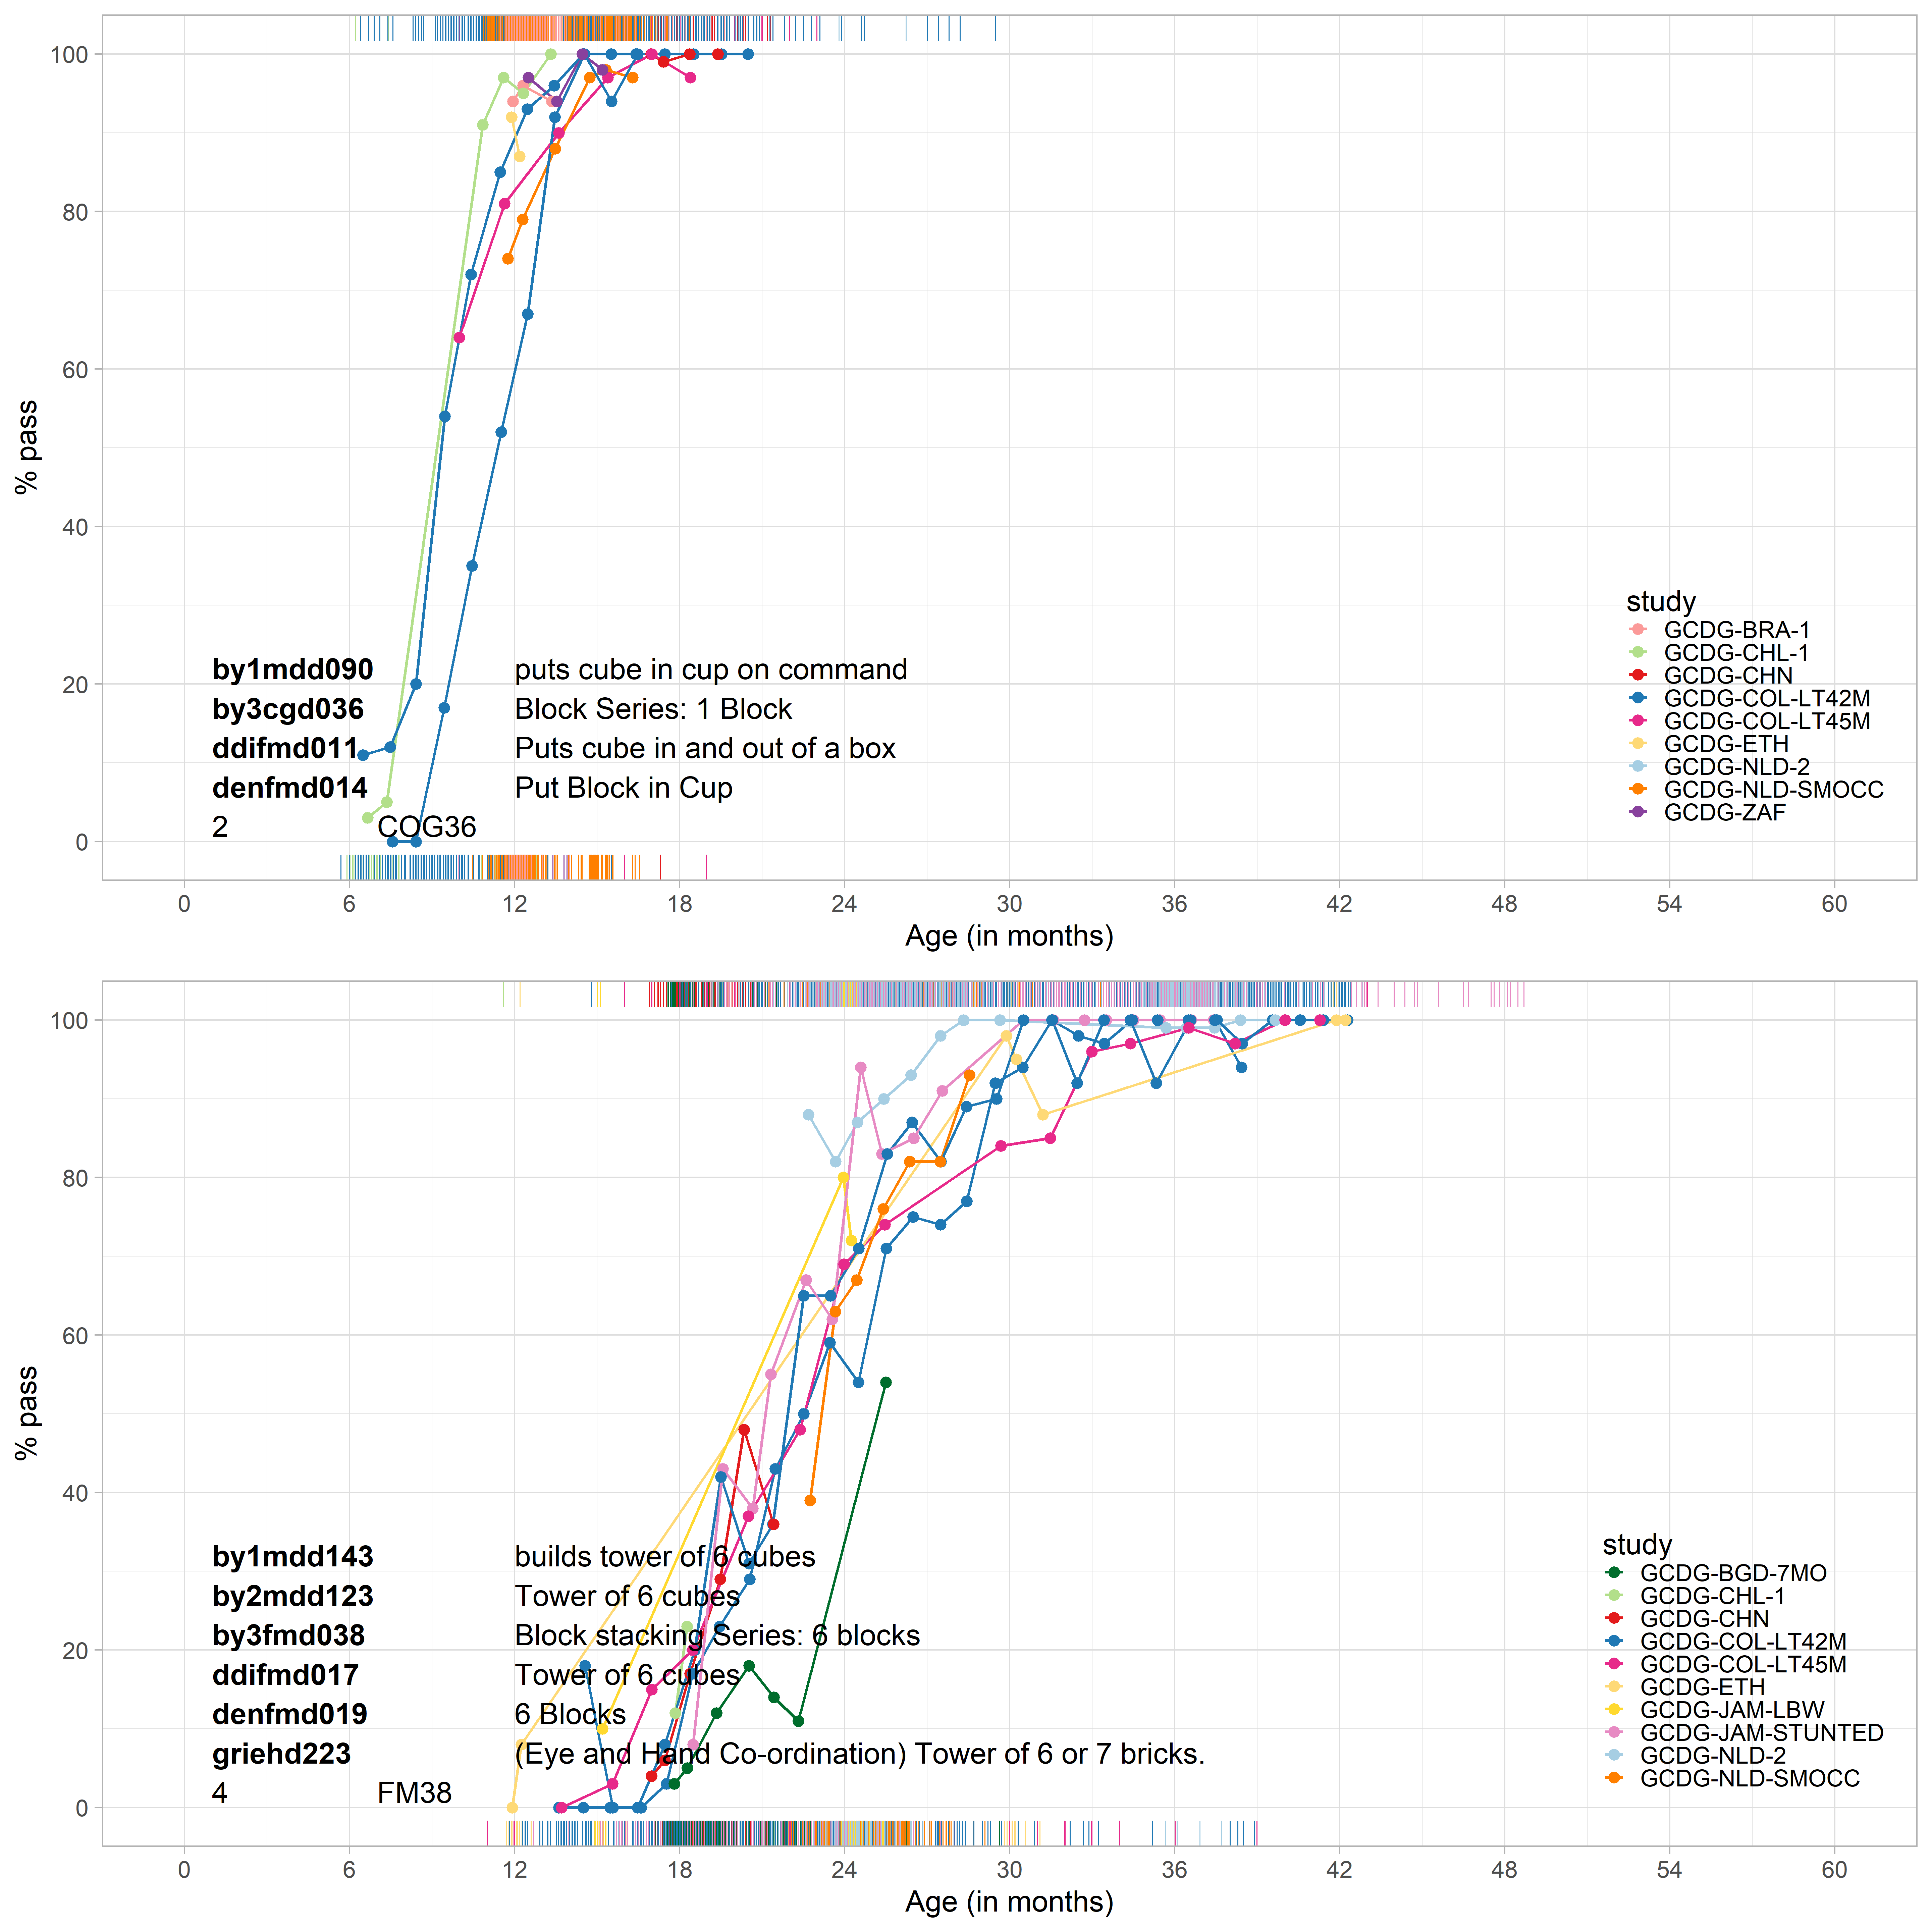
Figure 3.2: The probability of passing by age in potential bridging items.
Figure 3.3 presents two examples of weak item mappings. Notable timing differences exist for the “babbles” and “bangs” milestones, which suggests that we should not take these as bridges.
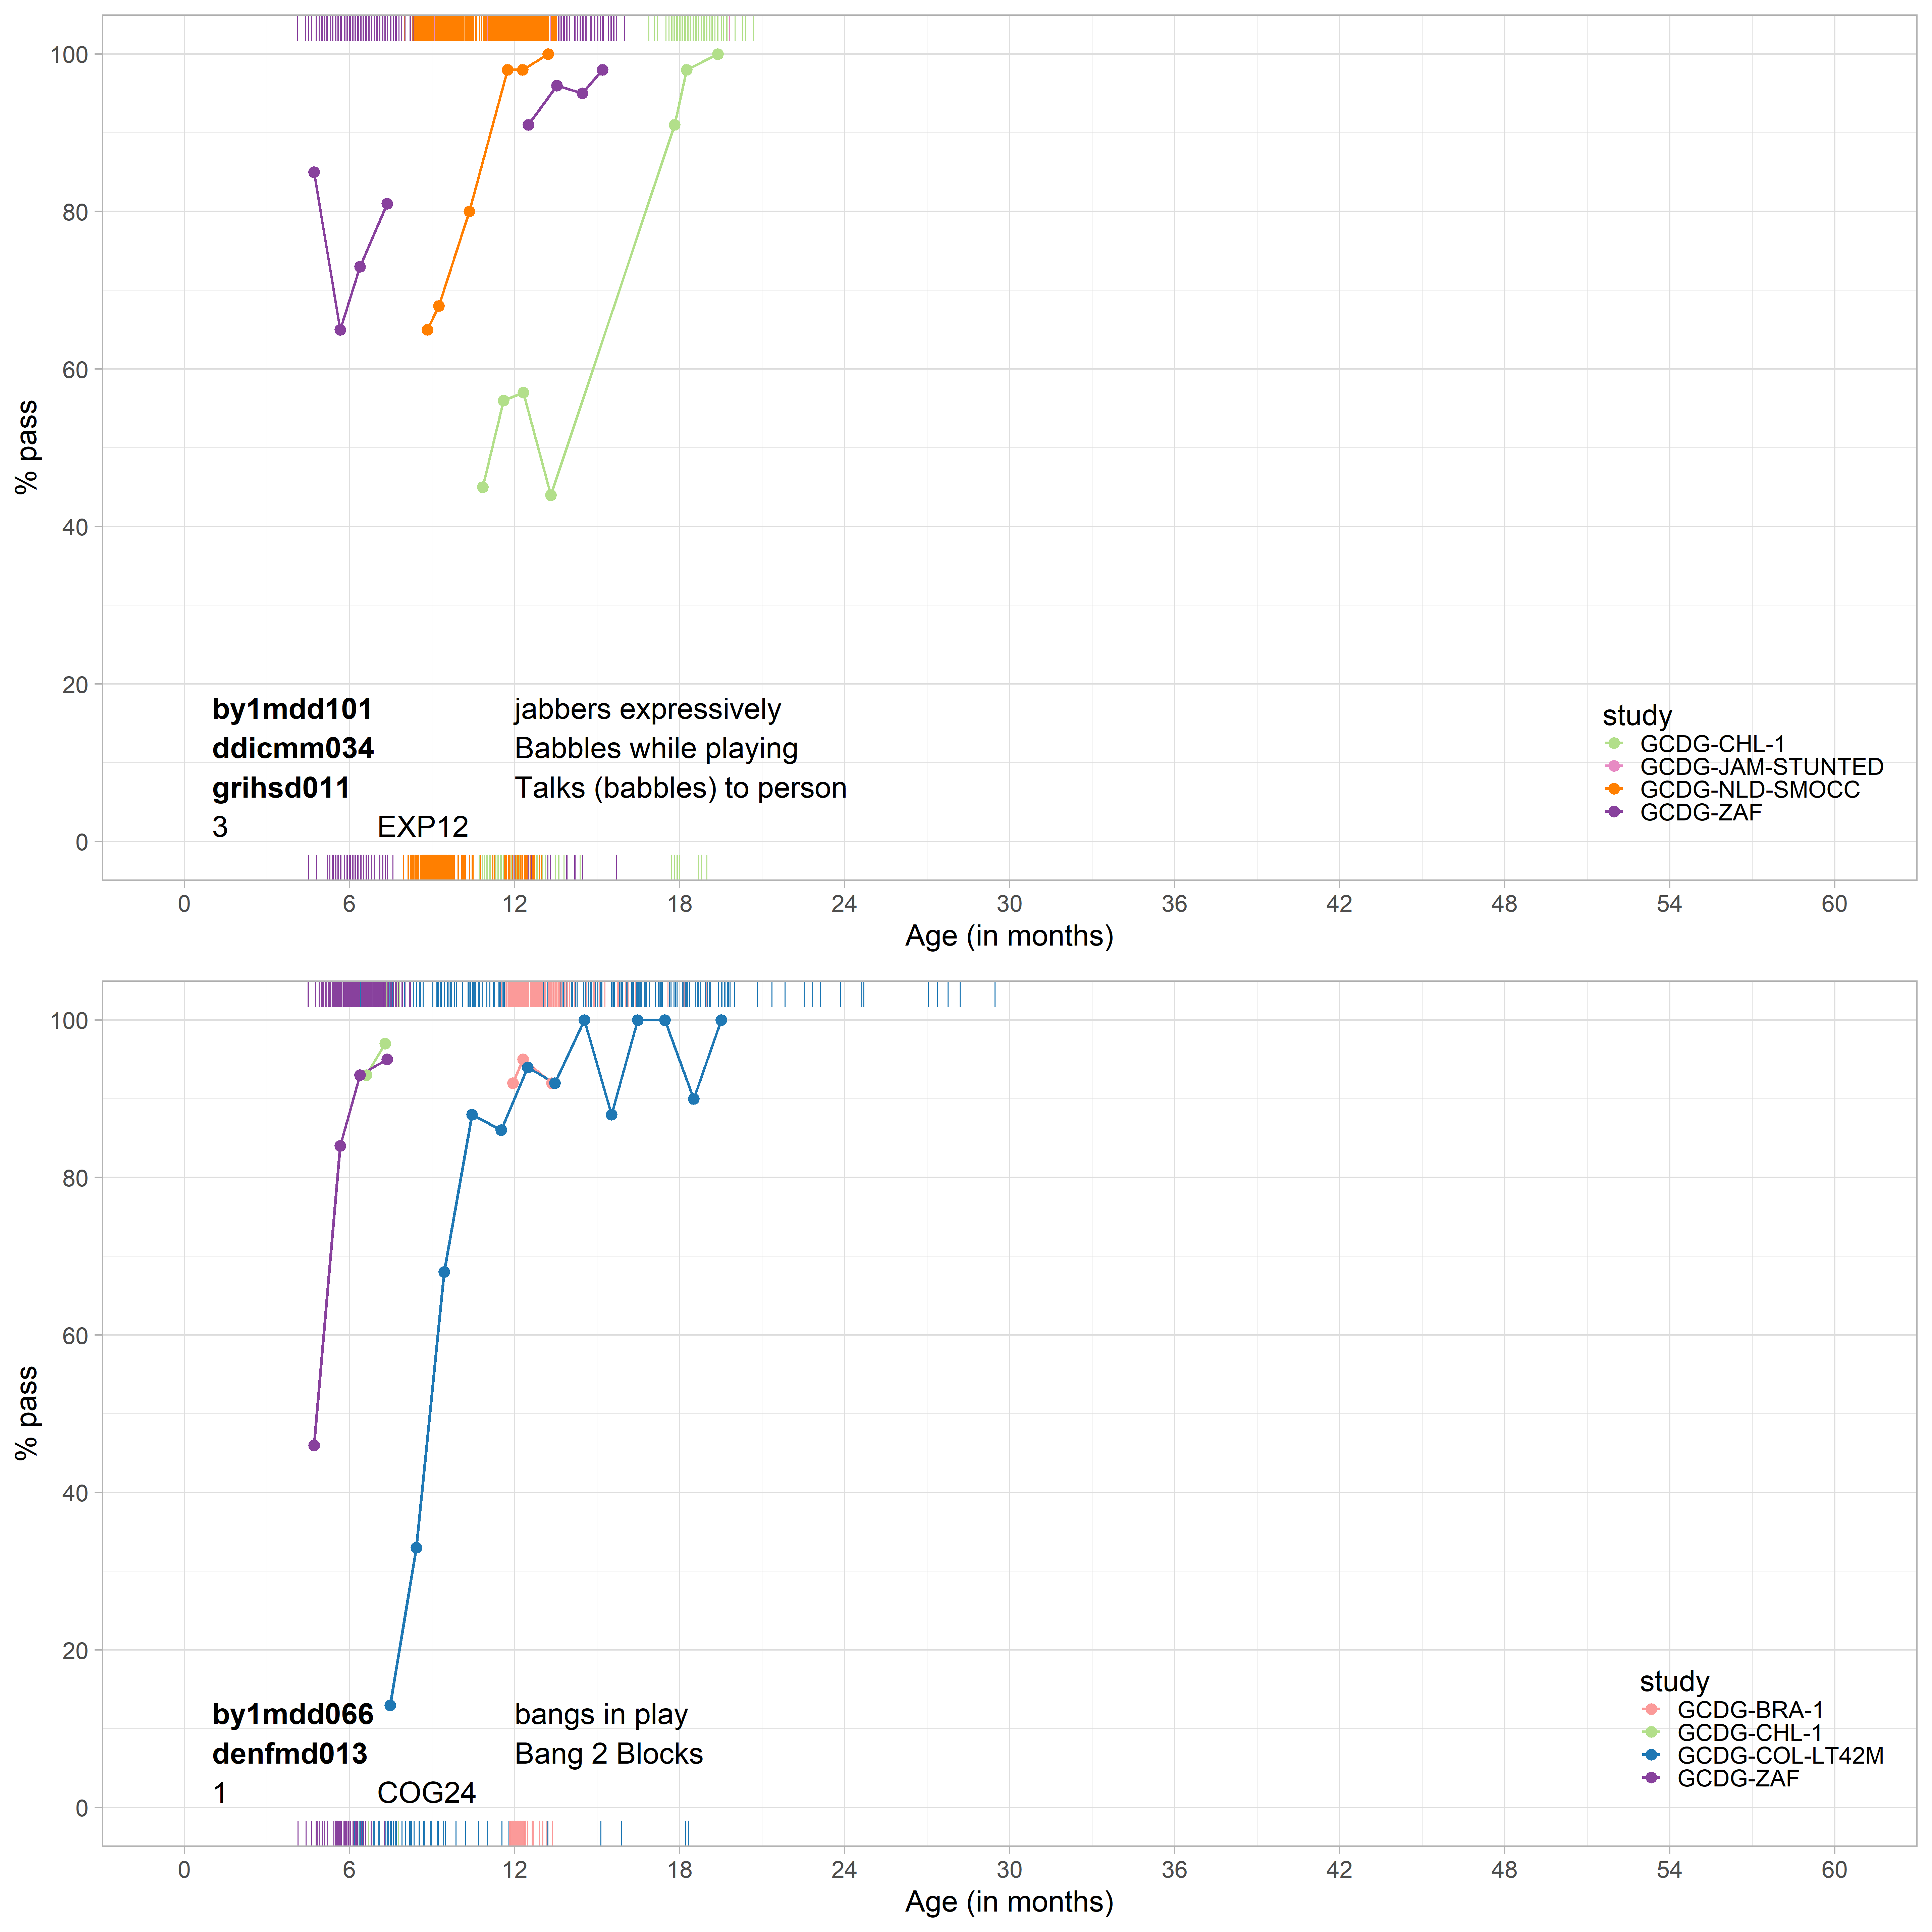
Figure 3.3: Probability to pass items for age in poor bridges.
While these plots are suggestive, their interpretation is surprisingly complicated. We may find that age profiles of two milestones A and B administered in samples 1 and 2 respectively are identical if
- A and B are equally difficult and samples 1 and 2 have the same maturation level;
- A is more difficult than B and sample 1 is more advanced than 2.
Similarly, we may find that the age profile for A is earlier than B if
- A is easier than B and if samples 1 and 2 have the same level of maturation;
- A and B are equally difficult and if sample 1 is more advanced than sample 2.
Note that the age curves confound difficulty and ability, and hence cannot be used to evaluate the quality of the item map.
What we need to do is separate difficulty and ability. For this, we need a formal statistical model. The next section introduces the concepts required in such a model.