6.2 Precision of the D-score
The EAP algorithm estimates the D-score from a set of PASS/FAIL scores. The standard deviation of the posterior distribution (or sem: standard error of measurement) quantifies the imprecision of the D-score estimate. The sem is inversely related to the number of items. Thus, when we administer more milestones, the sem of the D-score drops.
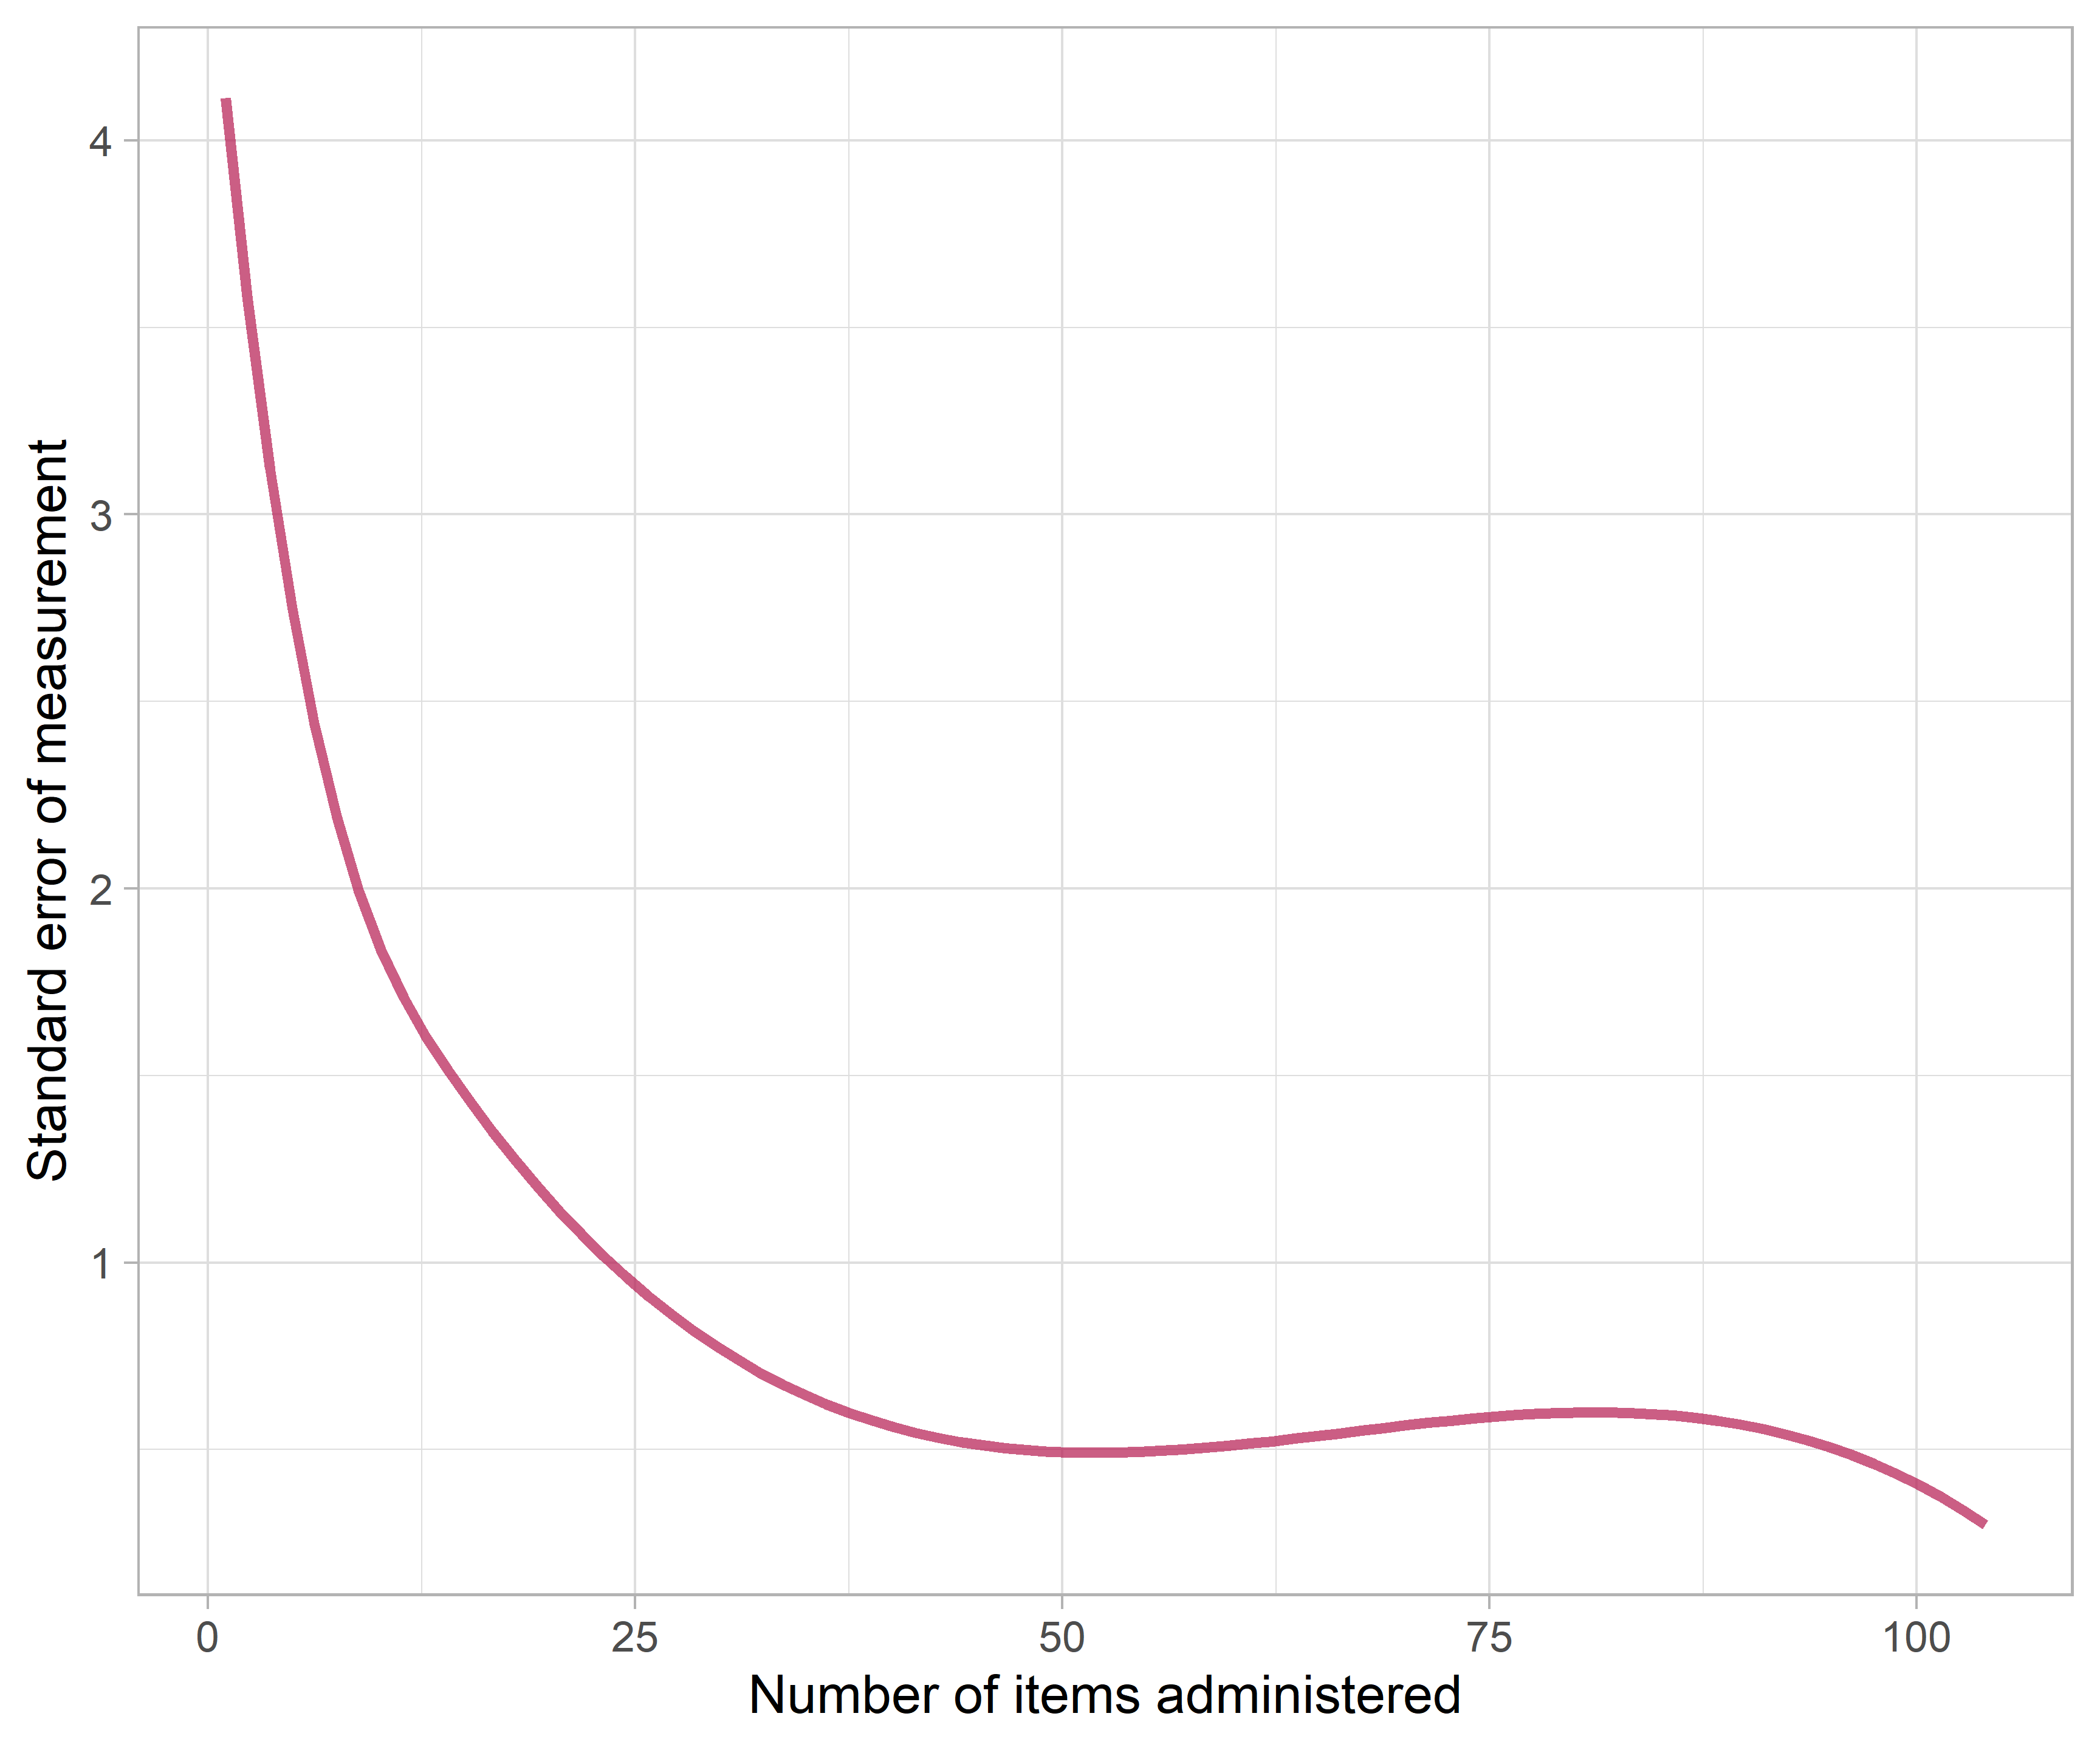
Figure 6.3: Standard error of measurement (sem) as a function of the number of items.
Figure 6.3 shows that the sem drops off rapidly when the number of items is low and stabilises after about 35 items. Apart from test length, the precision of the D-score also depends on item information (c.f. section 5.8). Administering items that are too easy, or too difficult, does not improve precision. The figure suggests that - in practice - a single D-score cannot be more precise than 0.5 D-score units.
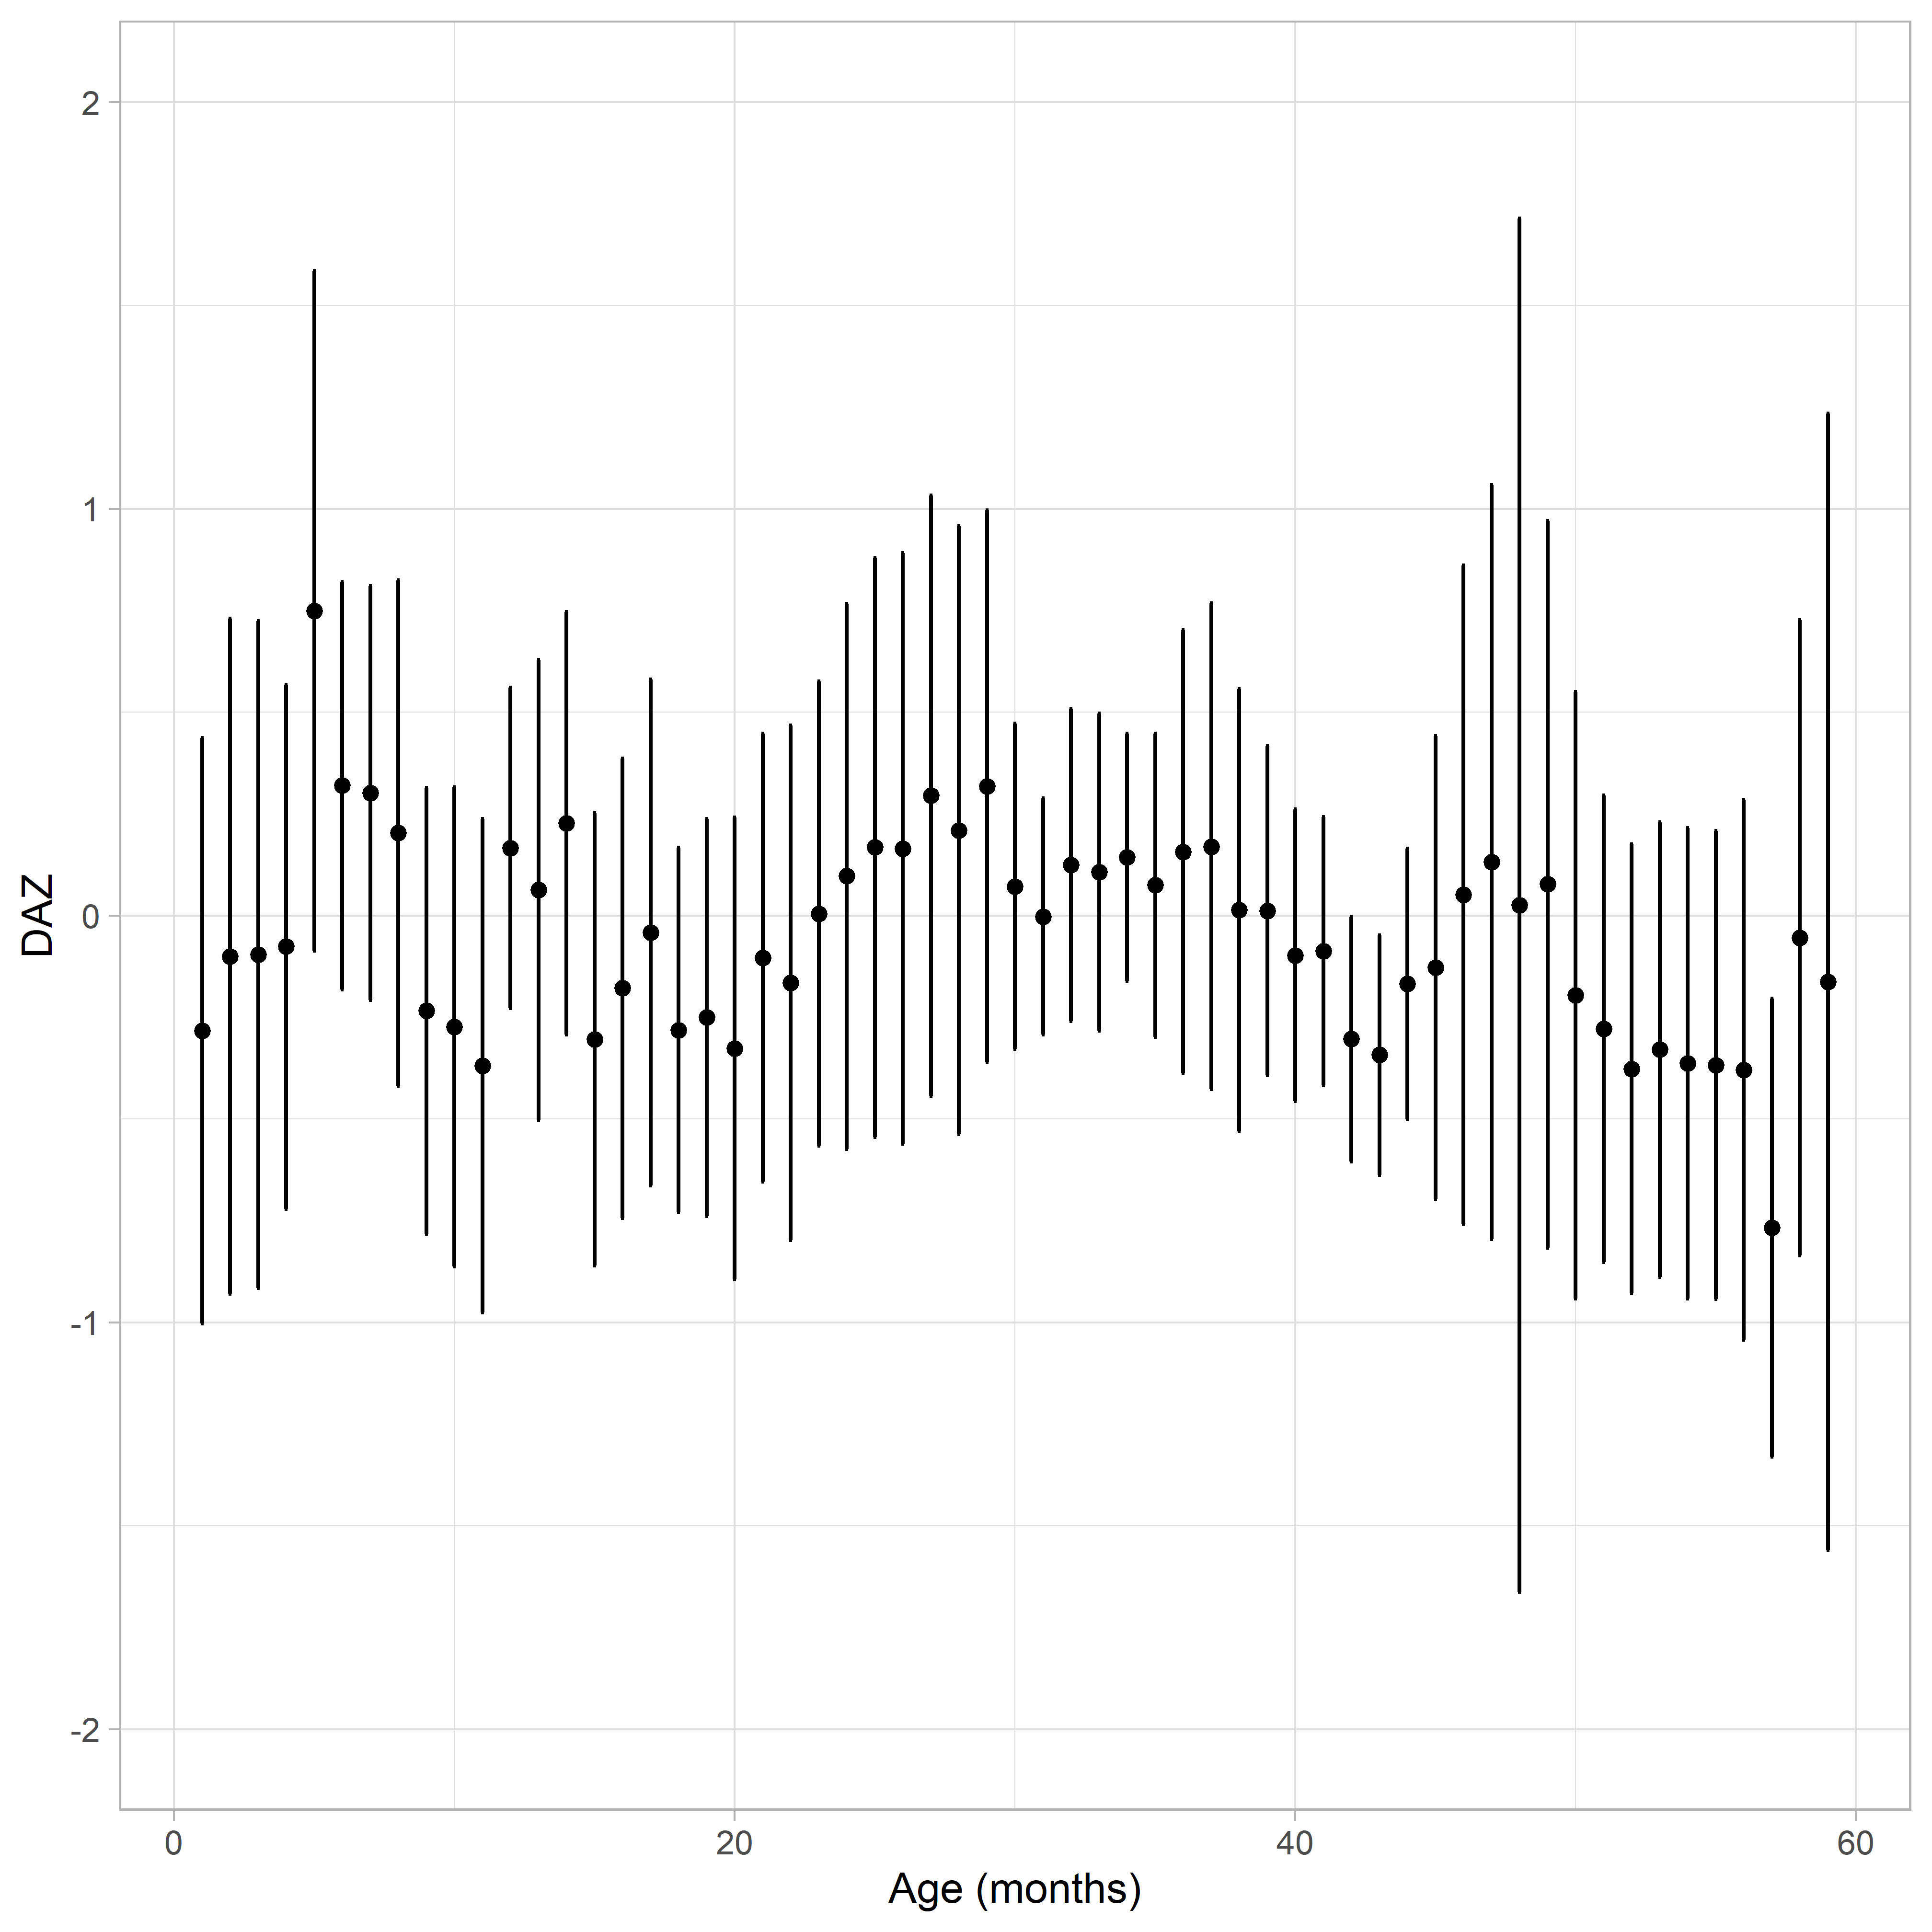
Figure 6.4: Mean DAZ \(\pm\) sem as a function of age.
One may wonder whether the sem depends on age. Figure 6.4 suggests that this is not the case. The average DAZ is close to zero everywhere, as expected. The interval DAZ \(\pm\) sem will cover the true, but unknown, DAZ in about 68% of the cases. While the interval varies somewhat across ages, there is no systematic age trend.
Figure 6.5: The standard error of measurement (\(sem\)) around the age-standardized D-scores (DAZ) per cohort (https://d-score.org/dbook-apps/gcdgsem).
Does precision vary with studies? The answer is yes. Figure 6.5 plots the same information as before but now broken down according to cohort. Individual data points are added to give a feel for the design. The Colombia cohort GCDG-COL-LT45M administered the Bayley-III, where each child answered on average 45 items, so the sem is small. In contrast, the Dutch cohort GCDG-NLD-SMOCC collected data on a screener consisting of about ten relatively easy milestones, so the sem is relatively large. As a result, the Colombian D-scores are much more precise than the Dutch.
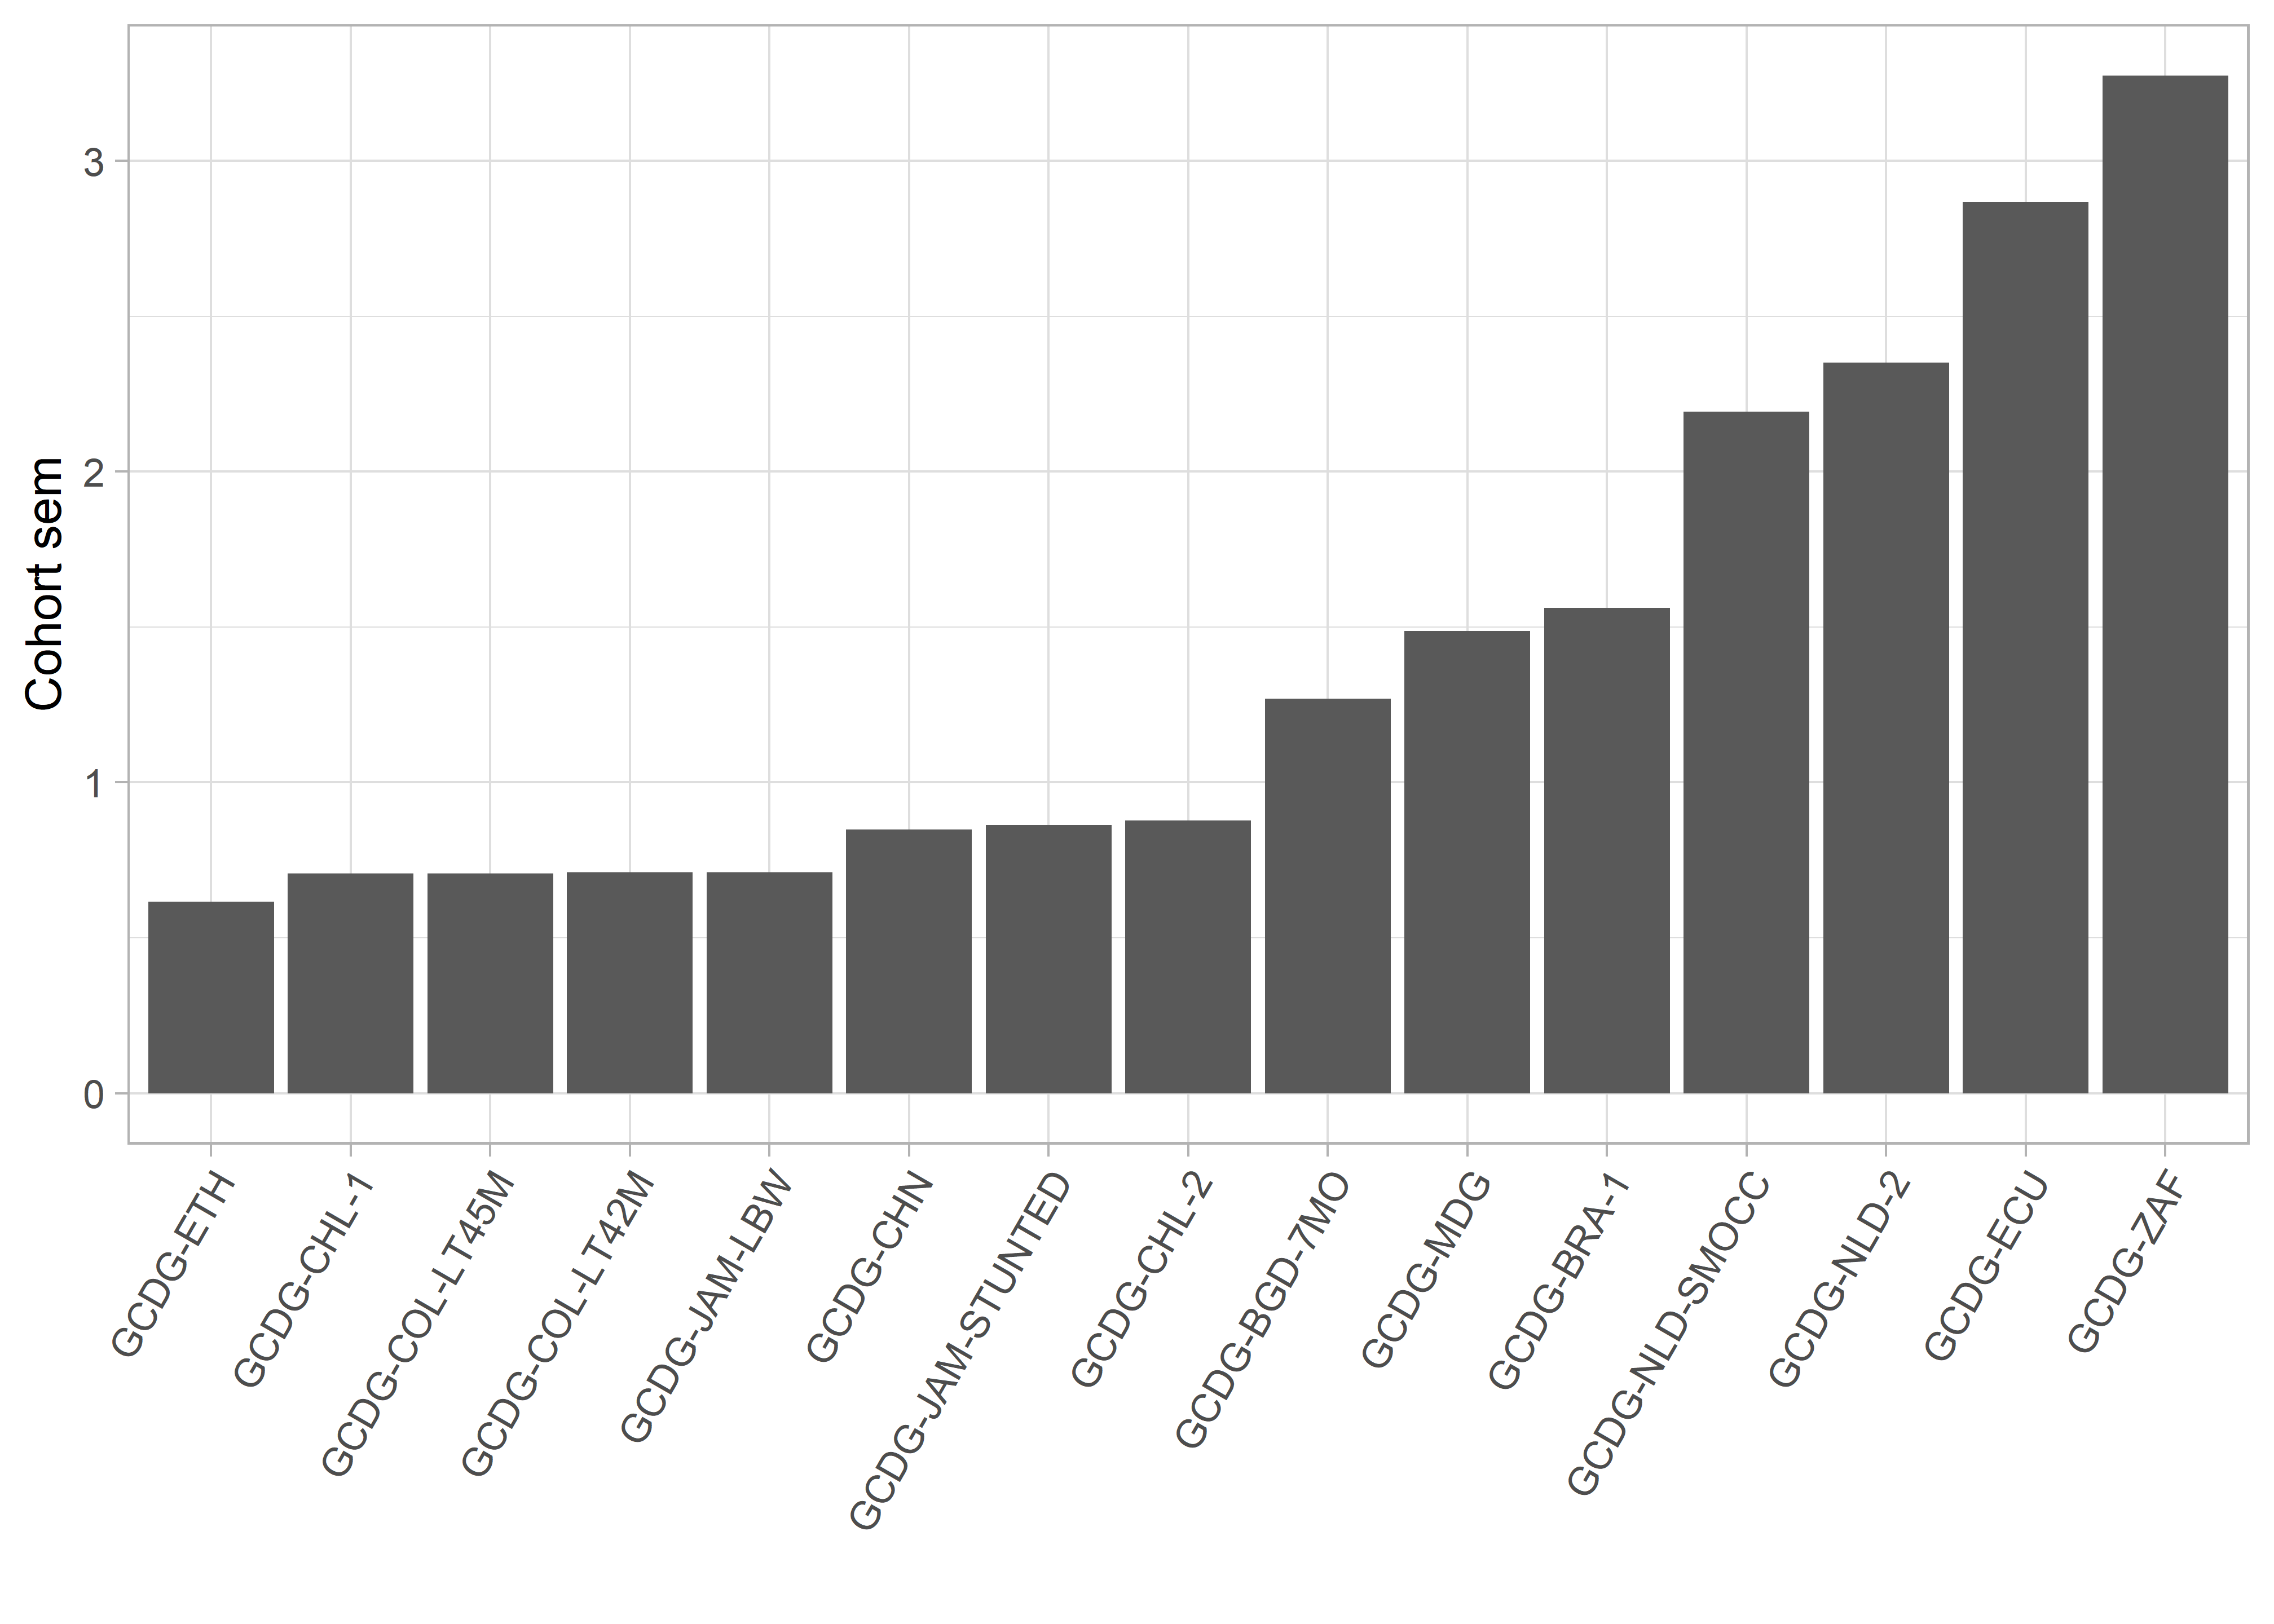
Figure 6.6: Cohort Standard Error of Measurement (sem).
Cohort | Test length | Pass probability |
GCDG-ETH | 39 | 0.66 |
GCDG-CHL-1 | 32 | 0.67 |
GCDG-COL-LT45M | 45 | 0.64 |
GCDG-COL-LT42M | 61 | 0.62 |
GCDG-JAM-LBW | 43 | 0.55 |
GCDG-CHN | 27 | 0.50 |
GCDG-JAM-STUNTED | 38 | 0.65 |
GCDG-CHL-2 | 33 | 0.48 |
GCDG-BGD-7MO | 14 | 0.38 |
GCDG-MDG | 8 | 0.35 |
GCDG-BRA-1 | 18 | 0.89 |
GCDG-NLD-SMOCC | 10 | 0.80 |
GCDG-NLD-2 | 11 | 1.00 |
GCDG-ECU | 3 | 0.67 |
GCDG-ZAF | 12 | 1.00 |
The ordering of studies depends on test length and item information. Table 6.1 shows the median number of items per child (test length) and the probability to pass the item. The Ethiopian cohort GCDG-ETH administered 39 milestones with a median probability of 0.66. In contrast, the South Africa study GCDG-ZAF measures 12 items which were all very easy for the sample at hand (median probability of 1.0). One may thus well explain the extremes by test length and item information.
In general, the design of the study has a significant impact on the precision of the measurement. Our ongoing work addresses the question how one may construct a measurement instrument that will be optimally precise given the goals of the research.