8.2 Factors that impact child development
We already know many of the factors that influence early child development. A higher level of education in the family promotes development. Infectious diseases like malaria slow down growth. Access to adequate nutrition, clean water and a stimulating, prosperous and safe environment is favourable for healthy development. And so on. Unfortunately, we do not have data on most factors, so we need to limit ourselves to a few background characteristics.
| n | % | n | % | ||
|---|---|---|---|---|---|
| sex | female | 21136 | 0.977 | 489 | 0.023 |
| male | 20805 | 0.972 | 595 | 0.028 | |
| birth weight | <2500gr | 3388 | 0.948 | 185 | 0.052 |
| >2500gr | 36375 | 0.978 | 821 | 0.022 | |
| maternal education | no education | 1907 | 0.967 | 66 | 0.033 |
| any primary | 11764 | 0.967 | 398 | 0.033 | |
| any secondary | 21576 | 0.977 | 503 | 0.023 | |
| higher secondary | 6263 | 0.984 | 101 | 0.016 | |
| residence | rural | 1251 | 0.989 | 14 | 0.011 |
| semi-urban | 2236 | 0.990 | 23 | 0.010 | |
| urban | 18740 | 0.971 | 566 | 0.029 | |
| metropolitan | 11122 | 0.979 | 234 | 0.021 | |
| * Exludes children with missing DAZ or missing factor |
Table 8.1 compares the frequency distributions of various factors for children on-track versus off-track. There are only tiny differences between boys and girls. Children with low birth weight (< 2500 gr) are more at risk for off-track development. This estimate does not correct for gestational age. We discussed techniques for such corrections elsewhere.
The influence of maternal education on off-track development follows the expected trend. Interestingly, it seems that a rural environment could prevent off-track development. We note that original measures of maternal education and residence had to harmonise across studies. It would, therefore, also be interesting to study the impact per cohort using the actual factor coding.
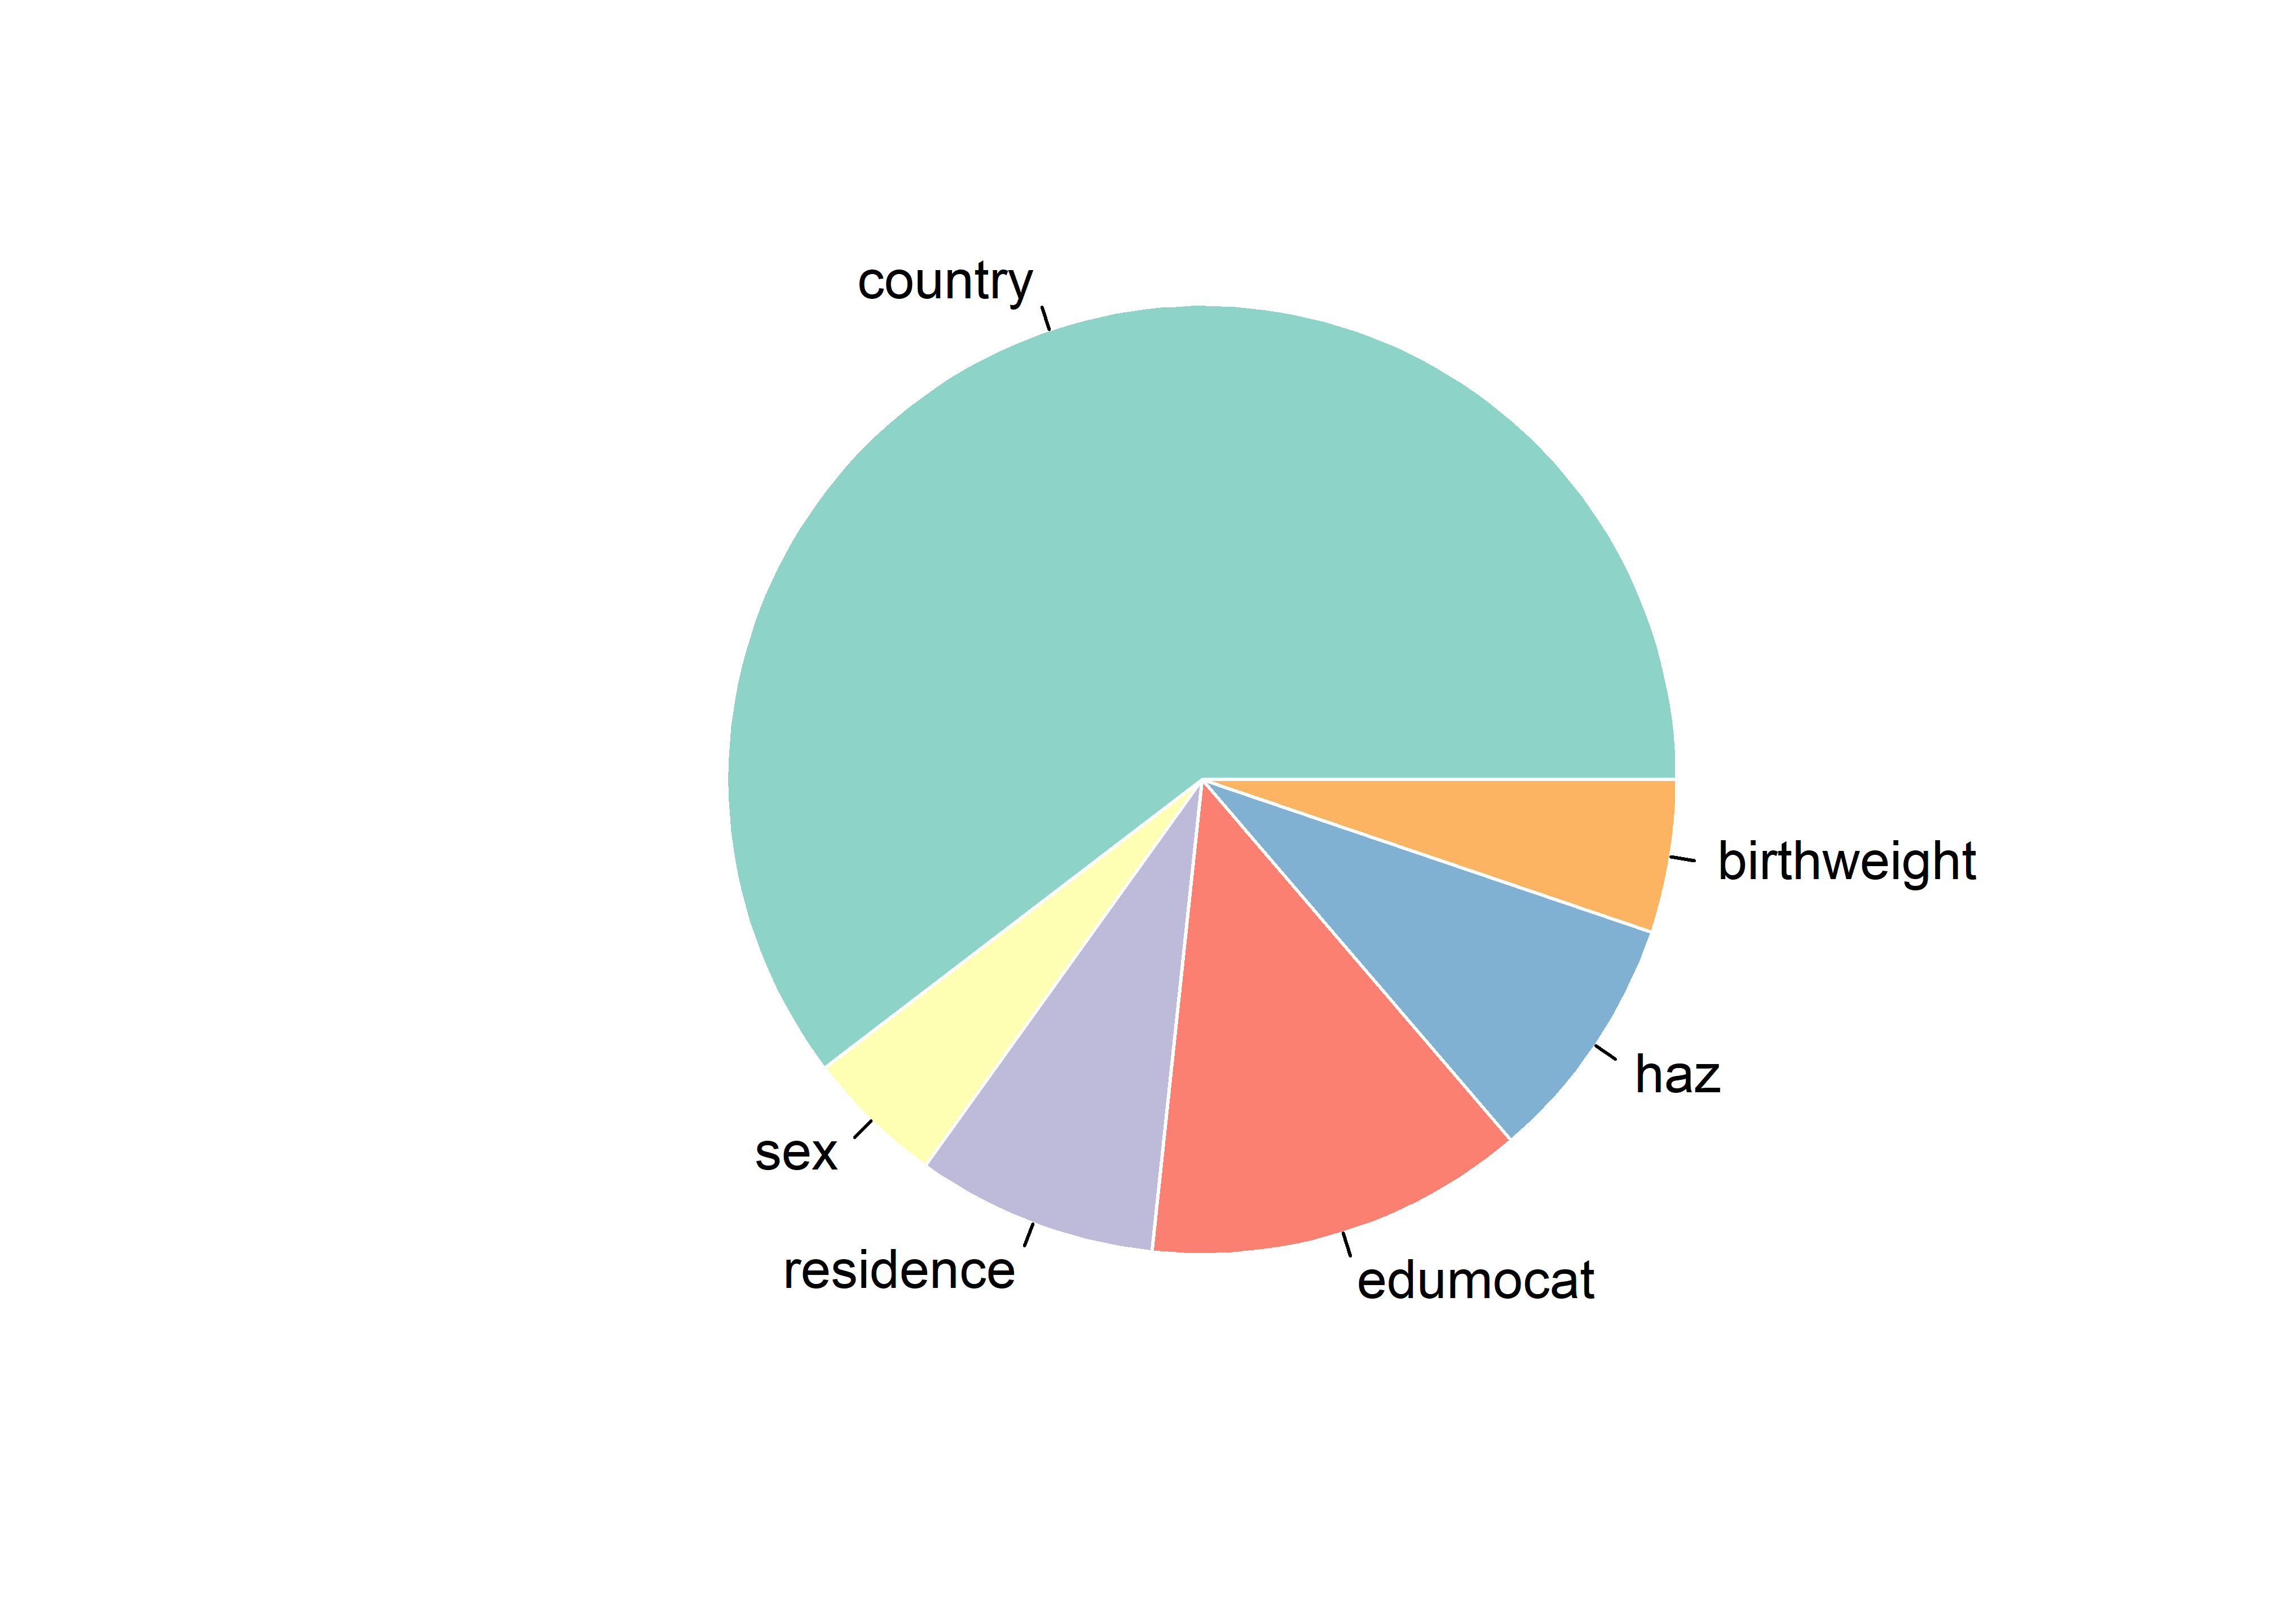
Figure 8.2: Relative importance of the explanatory factors in this study
We predicted DAZ by linear regressions with predictors country, sex, birth weight, maternal education, height for age and residential area. The percentage of explained variance was 11 per cent. Figure 8.2 depicts the relative contributions of the individual factors to the prediction. Country differences explain over half the variances, followed by maternal education. Contributions of height-for-age (HAZ), low birth weight and residence are about equal in magnitude.
These analyses only scratch the surface. It is nowadays common to analyse the impact of interventions on height and HAZ by multivariate techniques and machine learning methods. The D-score and DAZ are drop-in replacements that allow similar procedures to study which factors contribute to healthy child development worldwide.