9.2 POPS study
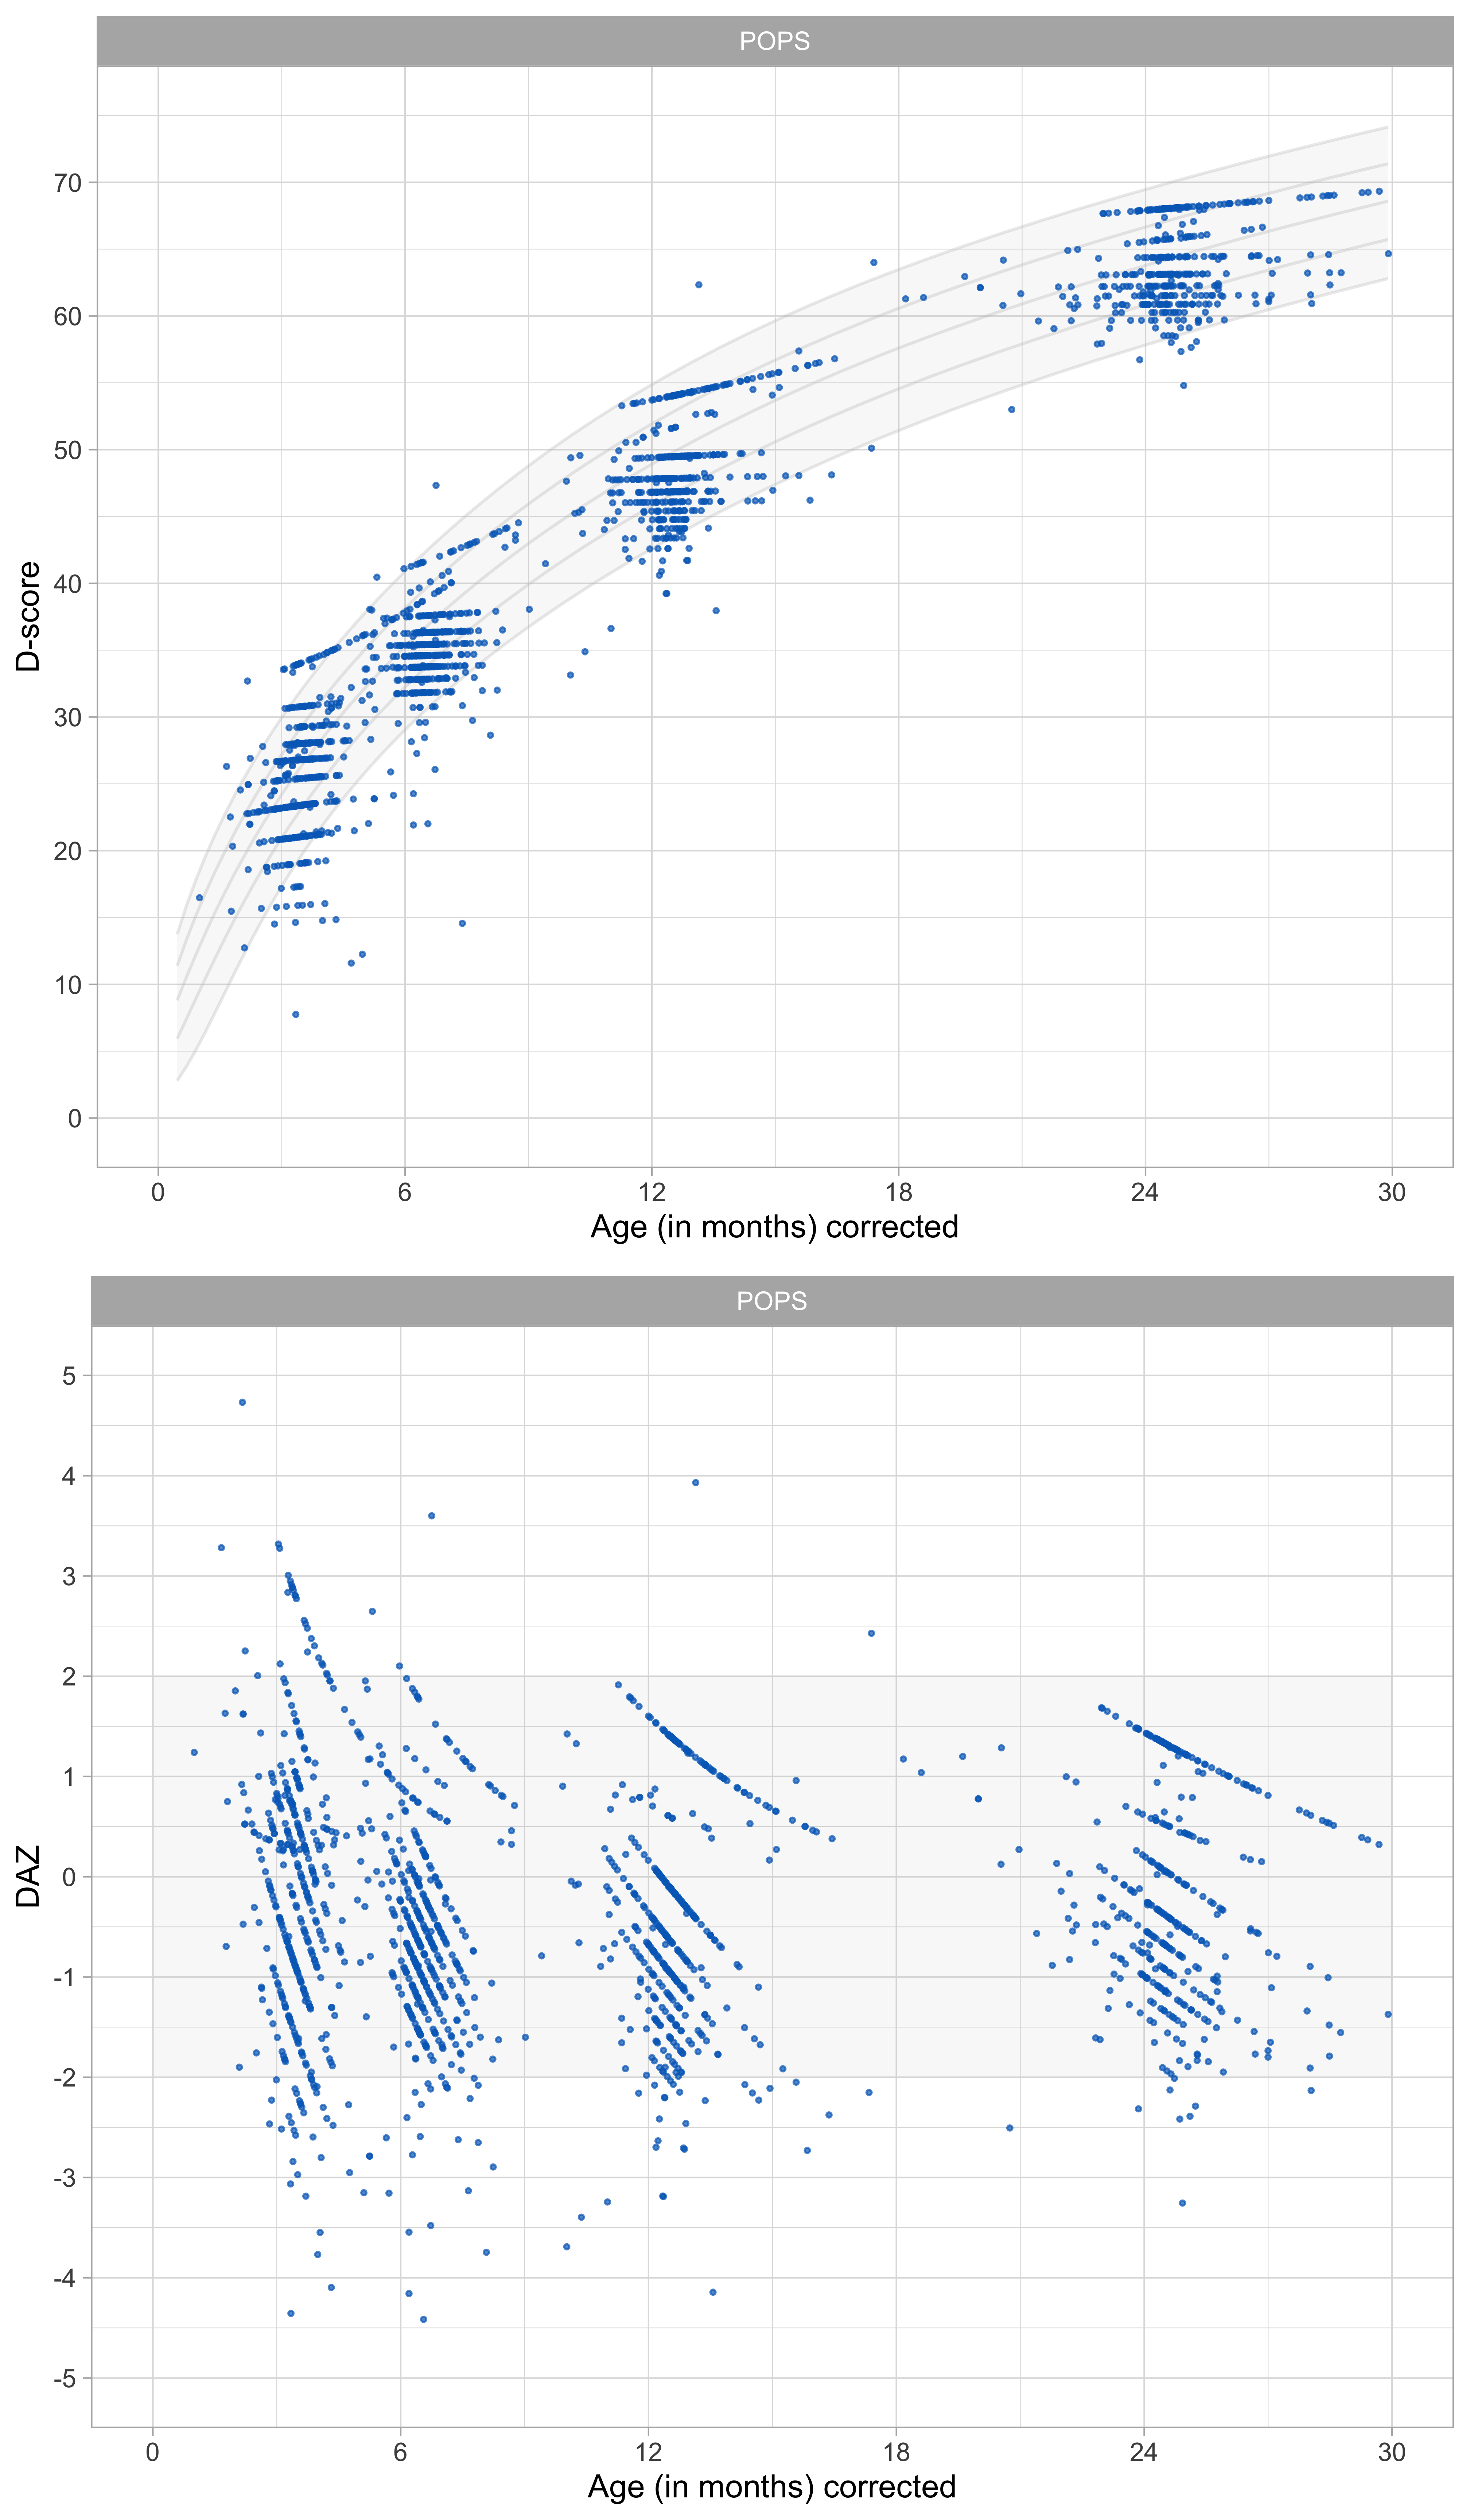
Figure 9.2: Distribution of D-score and DAZ by child age in a cohort of preterm aged 0-2 years. Ages are corrected for preterm birth by a factor of 0.75 (Source: POPS data, 450 children, four occasions).
Figure 9.2 presents the D-score and DAZ distributions for the POPS cohort of children born very preterm or with very low birth weight. The distributions of the D-score and DAZ are similar to those found in the SMOCC study.
Since the D-scores are calculated using the same milestones and difficulty estimates as used in the SMOCC data, the D-scores are comparable across the two studies. When the milestones differ between studies (e.g. when studies use different measurement instruments), it is still possible to calculate D-scores. This problem is a little more complicated, so we treat it in Chapter II.
The primary new complication here is the question whether it is fair to compare postnatal age of children born at term with postnatal ages of very preterm children. This section focuses on this issue in some detail.
9.2.1 POPS design
In 1983, the Project On Preterm and Small for Gestational Age Infants (POPS study) collected data on all 1338 infants in the Netherlands who had very preterm birth (gestational age < 32 weeks) or very low birth weight (birth weight < 1500 grams). See Verloove - Vanhorick et al. (1986) for details.
The POPS study determined gestational age from the best obstetric estimate, including the last menstrual period, results of pregnancy testing, and ultrasonography findings. The POPS study collected measurements on 450 children using the DDI at four visits at corrected postnatal ages of 3, 6, 12 and 24 months.
9.2.2 Age-adjustment
Assessment of very preterm children at the same chronological age as term children may cause over-diagnosis of developmental delay in very preterm children. Very preterm children may require additional time that allows for development equivalent to that of children born a term.
In anthropometry, it is common to correct chronological age of very preterm born children to enable age-appropriate evaluation of growth. For example, suppose the child is born as a gestational age of 30 weeks, which is ten weeks early. A full correction would deduct ten weeks from the child’s postnatal age, and a half correction would deduct five weeks. In particular, we calculate the corrected age (in days) as:
\[ \mathrm{corrected\ age} = \mathrm{postnatal\ age}\mathrm{\ (days)} - f \times [280 - \mathrm{gestational\ age\ (days)}], \]
where 280 is the average gestational age in days, and where we specify several alternatives for \(f\) as 1.00 (full correction), 0.75, 0.50 (half) or 0.00 (no correction).
Let’s apply the same idea to child development. Using corrected age instead of postnatal age has two consequences:
- It will affect the prior distribution for calculating the D-score;
- It will affect DAZ calculation.
We evaluate these two effects in turn.
9.2.3 Effect of age-adjustment on the D-score
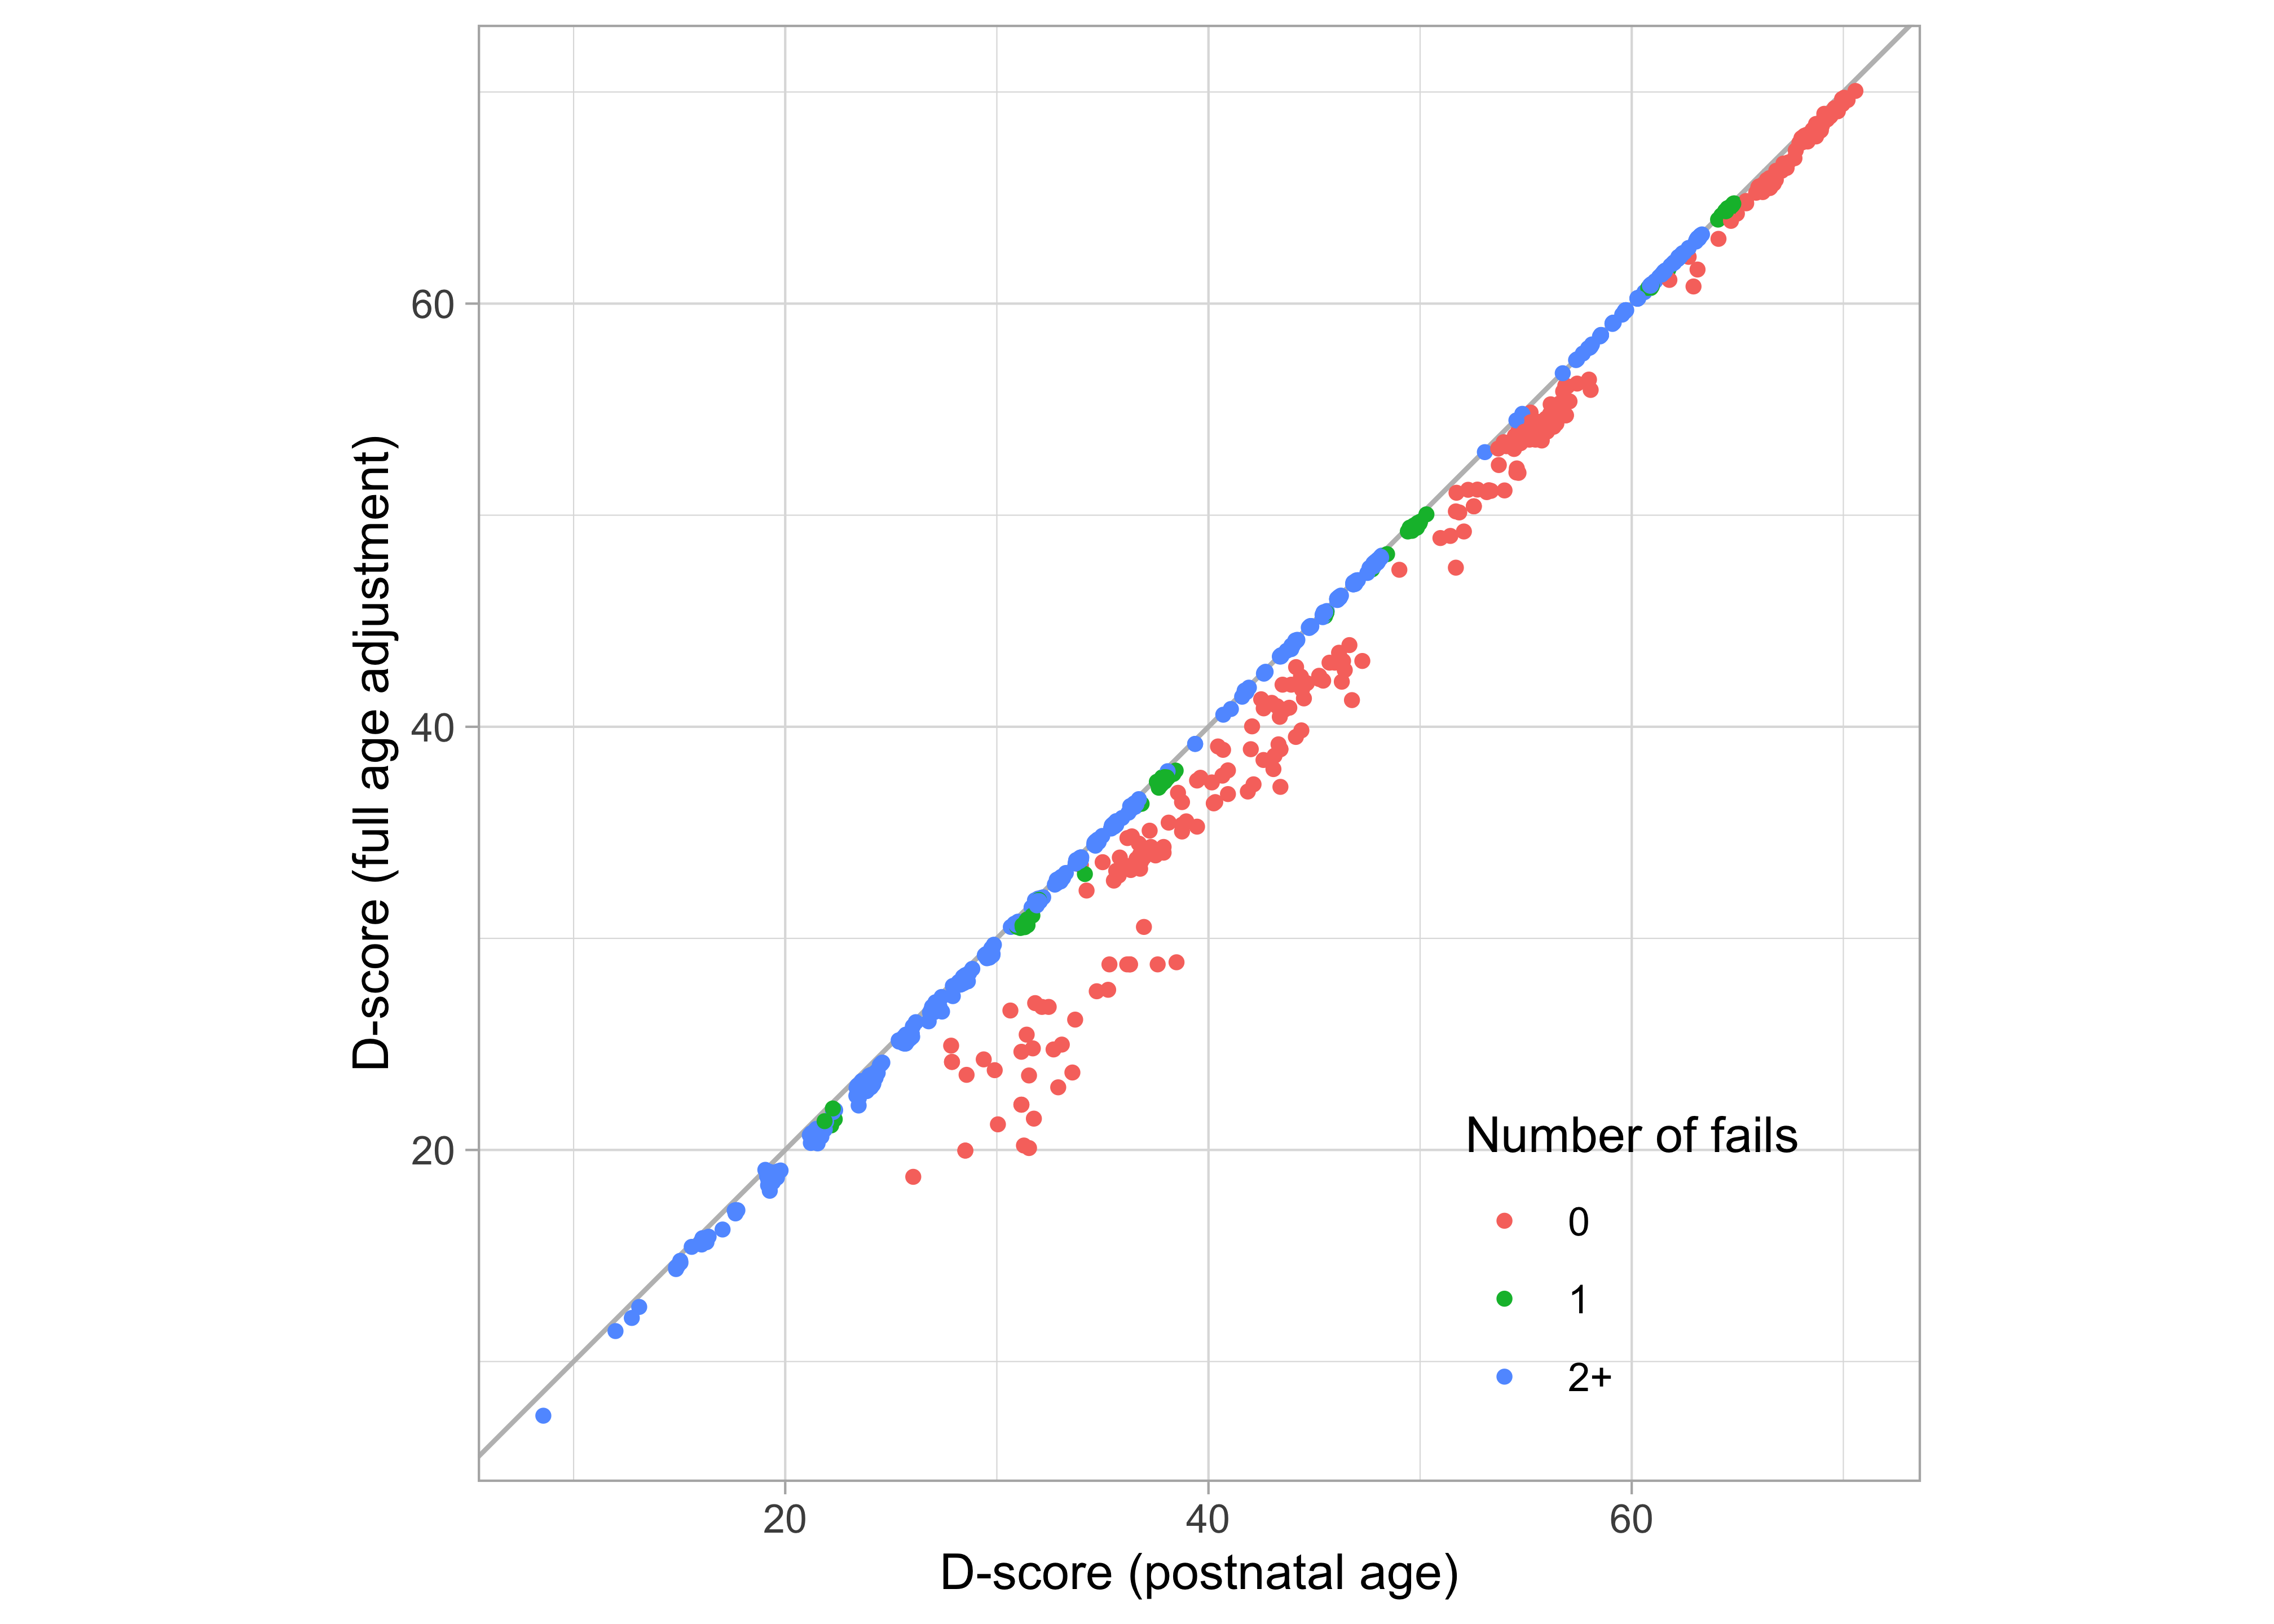
Figure 9.3: Scatterplot of two versions of the D-score, one calculated using postnatal age (\(f = 0.00\)), the other calculated using full age-adjustment (\(f = 1.00\)).
Figure 9.3 plots the fully age-adjusted D-score against the unadjusted D-score. Any discrepancies result only from differences in the ages used in the age-dependent prior (c.f. Section 5.3.2).
All points are on or below the diagonal. Age-adjustment lowers the D-score because a preterm is “made younger” by subtracting the missed pregnancy duration, and hence the prior distribution starts at the lower point. For example, the group of red marks with D-scores between 30\(D\) and 40\(D\) (age not corrected) will have D-scores between 20\(D\) and 30\(D\) when fully corrected. Note that only the red points (with perfect scores) are affected, thus illustrating that the prior has its most significant effect on the perfect response pattern. See also Section 5.3.1. The impact of age-correction on the D-score is negligible when the child fails on one or more milestones.
9.2.4 Effect of no age adjustment (\(f = 0.00\)) on the DAZ
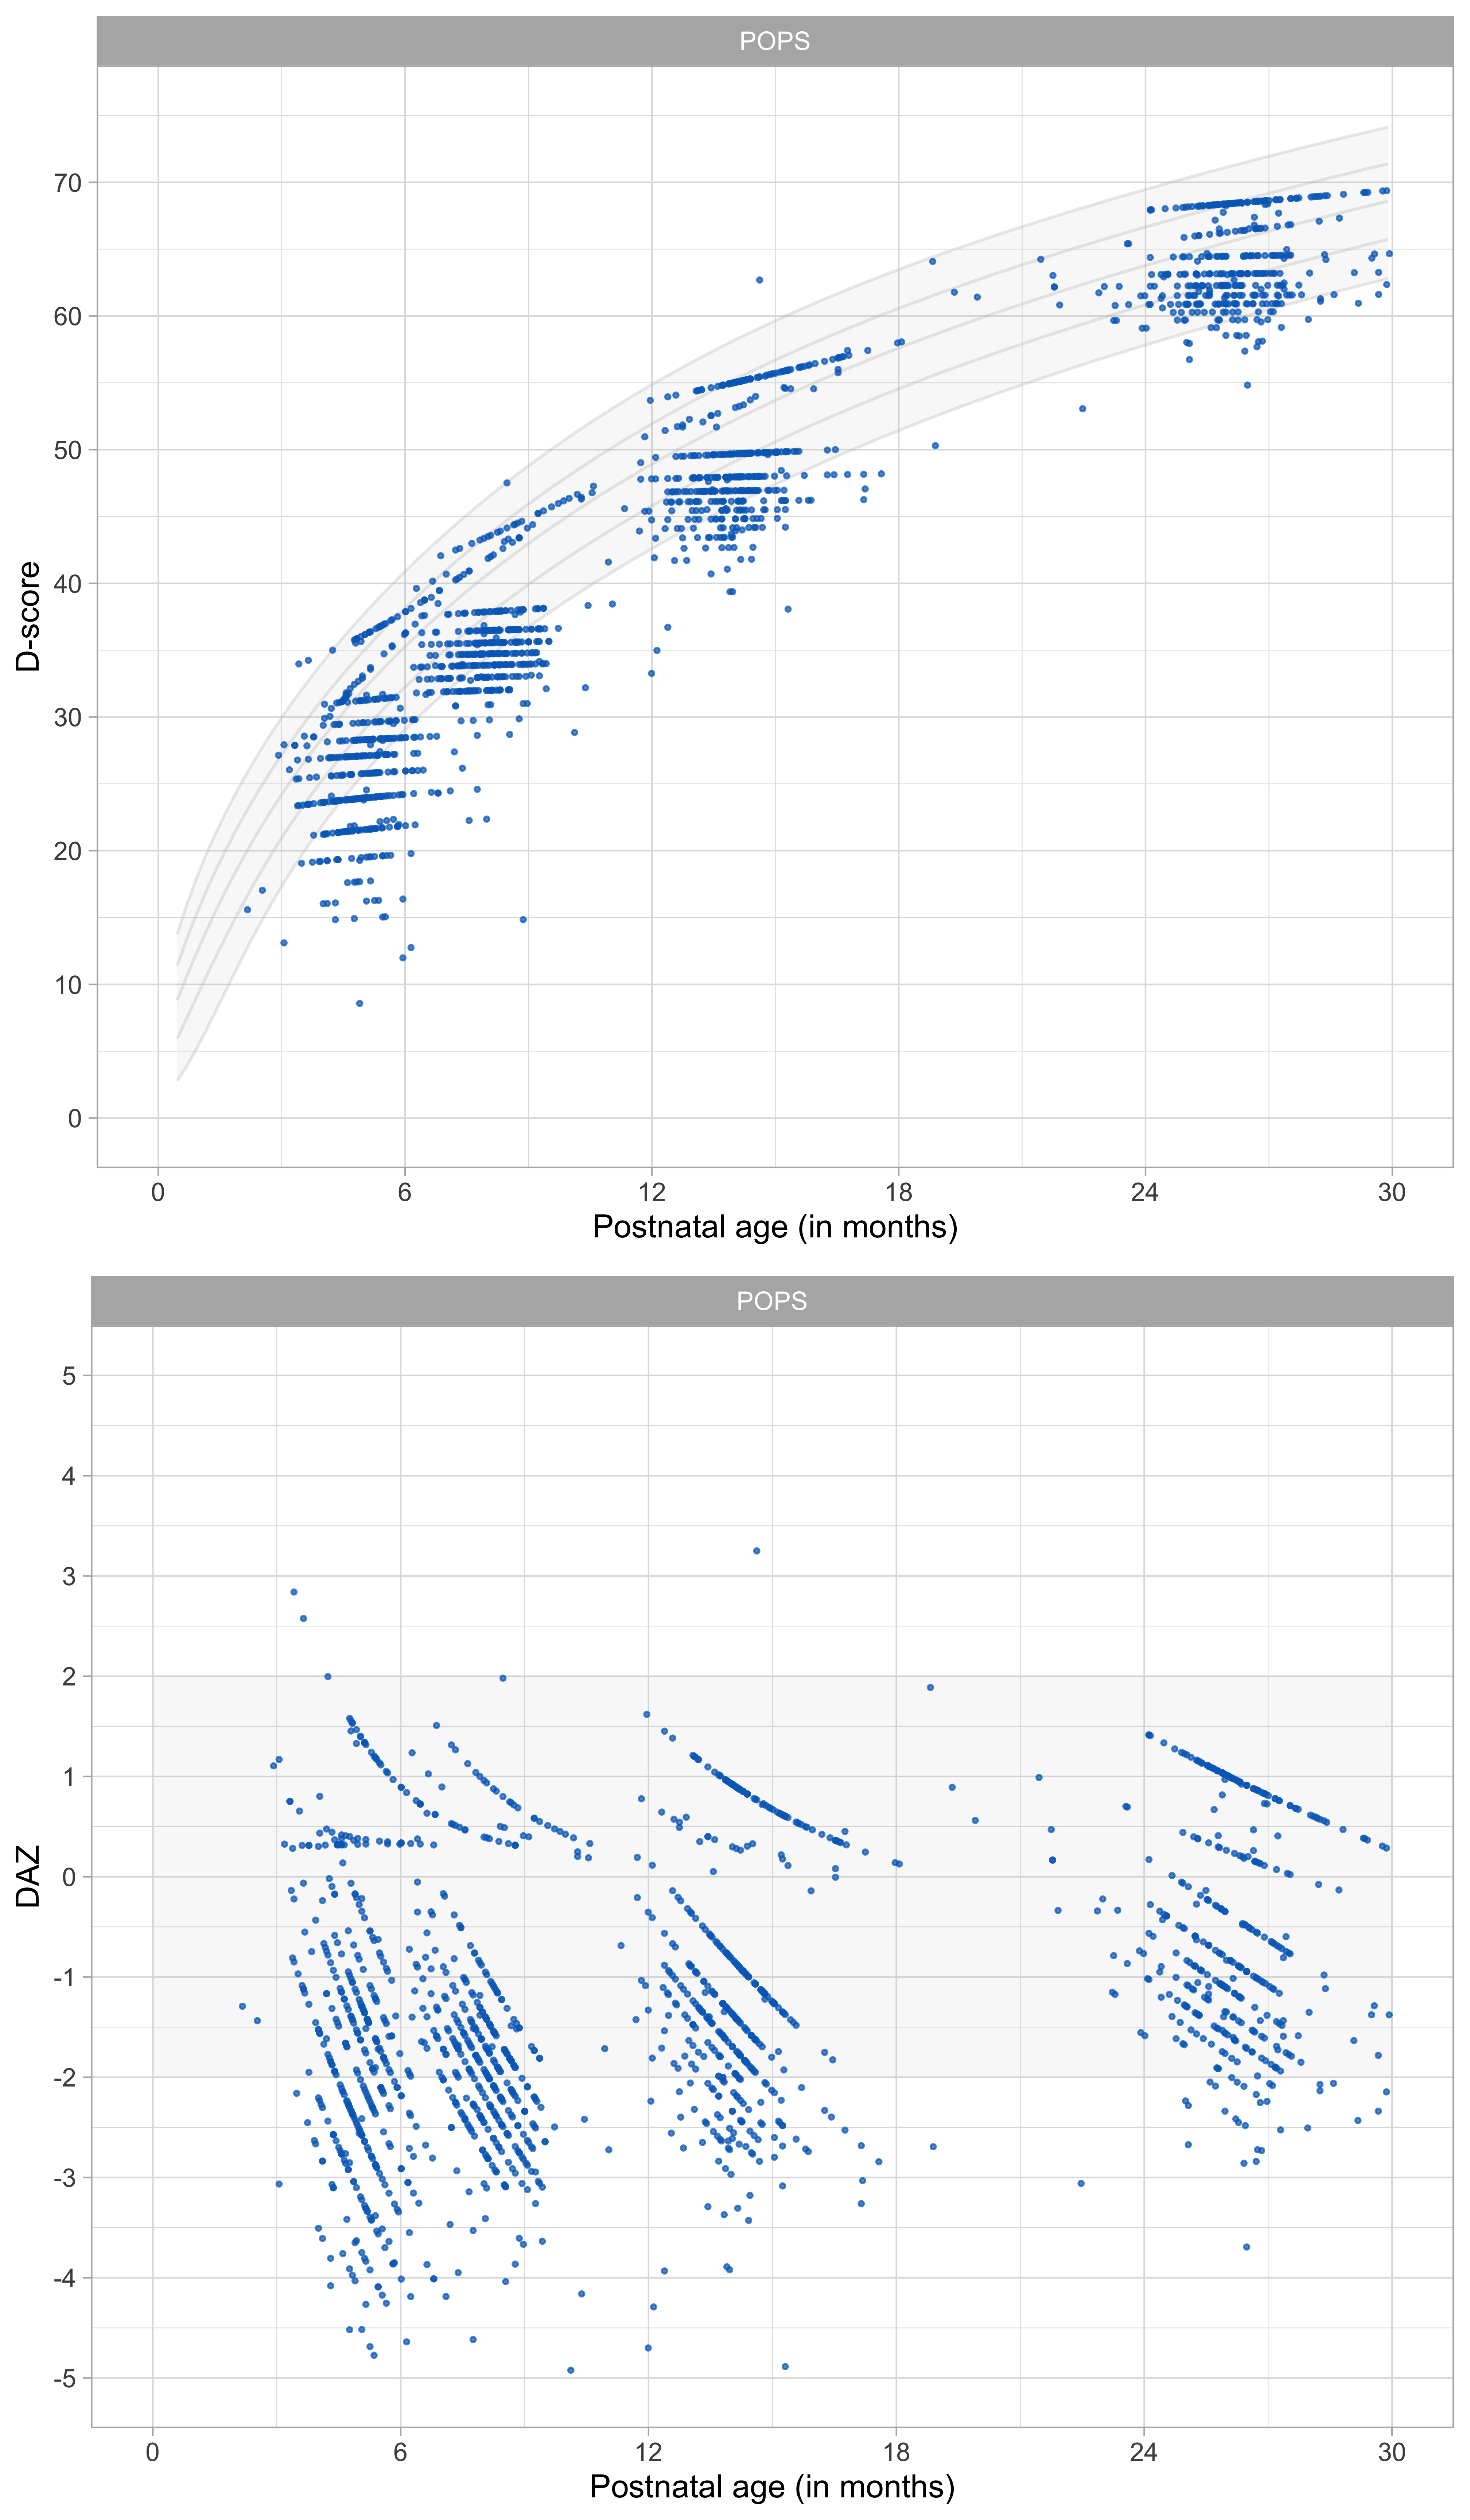
Figure 9.4: Distribution of D-score and DAZ without age correction for preterm birth (\(f = 0.00\)).
Figure 9.4 illustrates that a considerable number of D-scores fall below the minus -2 SD line of the reference when age is not adjusted, especially during the first year of life. The pattern suggests that the apparent slowness in development is primarily the result of being born early, and does not necessarily reflect delayed development.
9.2.5 Effect of full age adjustment (\(f = 1.00\)) on the DAZ
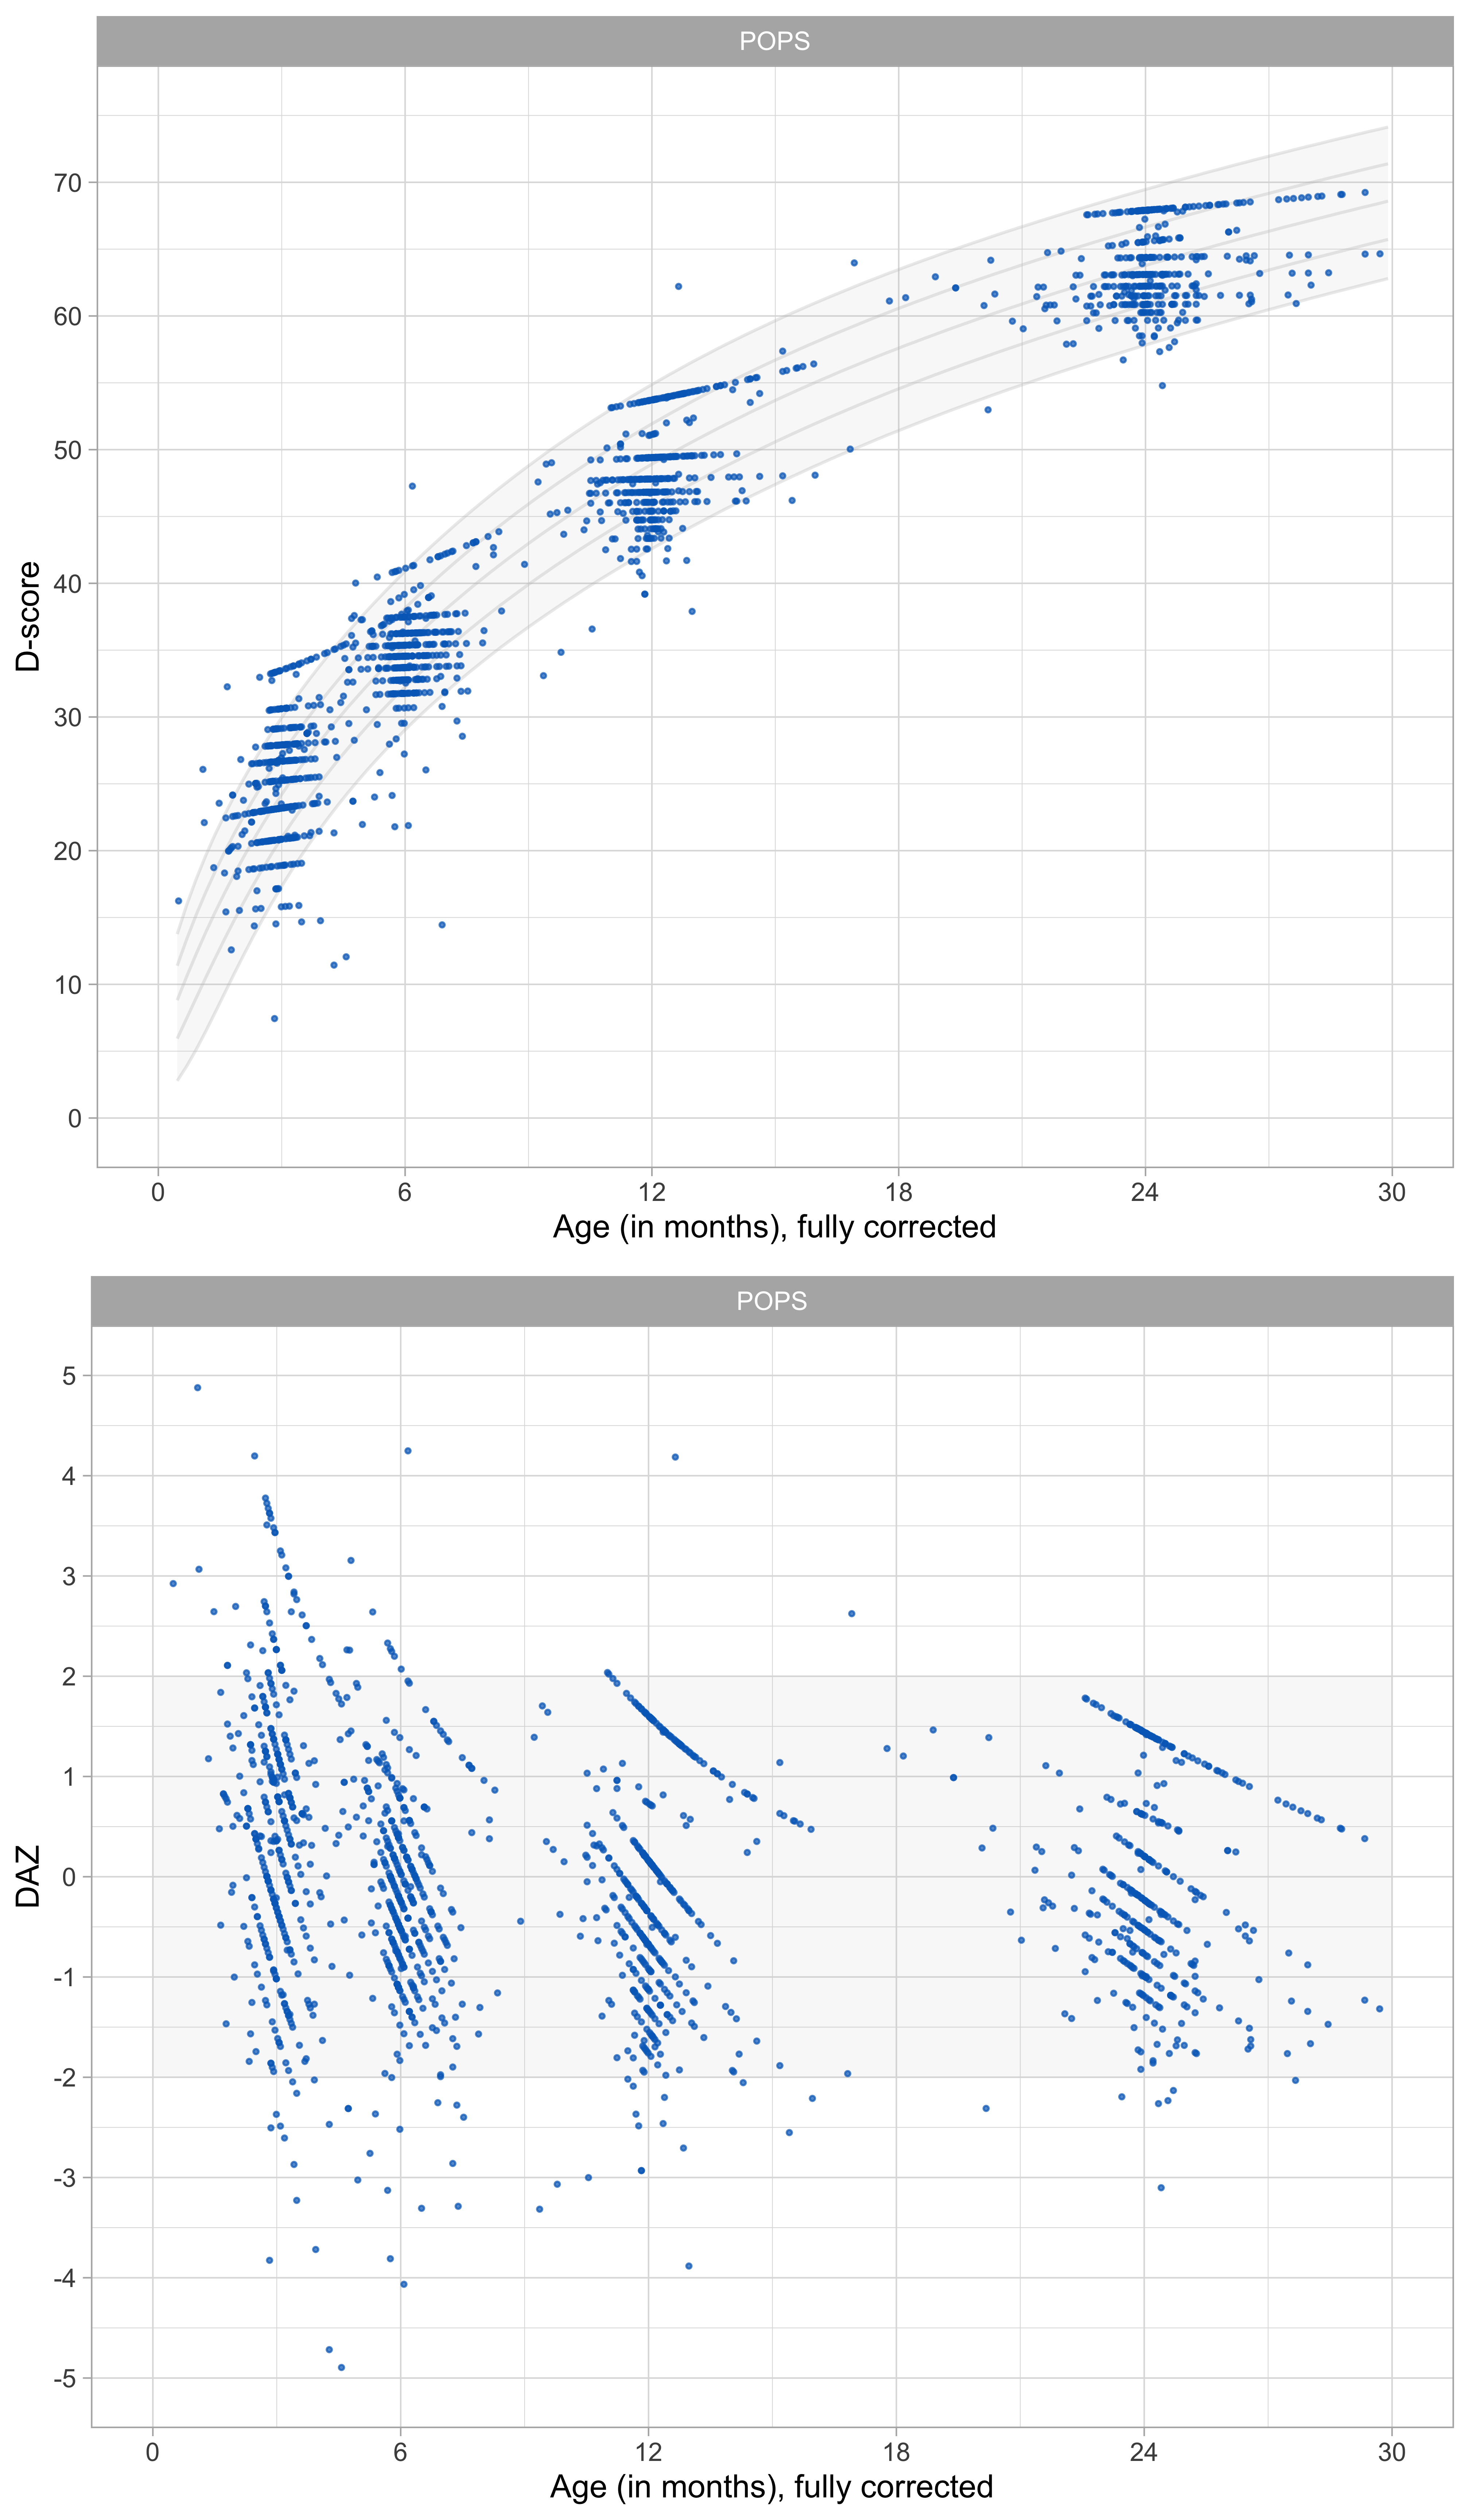
Figure 9.5: Distribution of D-score and DAZ under full age correction for preterm birth (\(f = 1.00\)).
Full age correction has a notable effect on the DAZ. Figure 9.5 illustrates that the POPS children are now somewhat advanced over the reference children. We ascribe this seemingly odd finding to more prolonged exposure to sound and vision in air. Thus after age correction, development in preterms during early infancy is advanced compared to just-born babies.
Full age correction seems to overcorrect the D-score, so it is natural to try intermediate values for \(f\) between 0 and 1.
9.2.6 Partial age adjustment
Age (months) | 0.00 | 0.50 | 0.75 | 1.00 |
0-3 | -1.46 | -0.50 | 0.07 | 0.73 |
3-4 | -1.77 | -0.89 | -0.37 | 0.20 |
5-6 | -1.60 | -0.87 | -0.46 | 0.00 |
7-8 | -1.76 | -1.13 | -0.77 | -0.39 |
9-11 | -1.21 | -0.77 | -0.53 | -0.28 |
12-14 | -0.99 | -0.60 | -0.39 | -0.16 |
15-23 | -0.50 | -0.23 | -0.10 | 0.04 |
24+ | -0.70 | -0.49 | -0.37 | -0.24 |
Table 9.1 compares mean DAZ under various specifications for \(f\). Values \(f = 0.00\) and \(f = 0.50\) do not correct for preterm birth enough in the sense that all sign are negative. In contrast, \(f = 1.00\) overcorrects. The value of 0.73 is implausibly high, especially because this value is close to birth. Setting \(f = 0.75\) seems a good compromise, in the sense that the average DAZ is close to zero in the first age interval. The average DAZ is negative at later ages. We do not know whether this genuinely reflects less than optimal development of very preterm and low birth weight children, so either \(f = 1.00\) and \(f = 0.75\) are suitable candidates.
9.2.7 Conclusions
- Compared with the general population, more very preterm children reached developmental milestones within chronological age five months when chronological age was fully corrected;
- Fewer preterm children reached the milestones when chronological age was not corrected;
- Fewer children reached the milestones when we used a correction of \(f = 0.50\);
- Similar proportions were observed when we used \(f = 0.75\) within the first five months after birth.
- After chronological age five months, we observed similar proportions for very preterm and full-term children when chronological age was fully corrected.
- We recommend using full age correction (\(f = 1.00\)). This advice corresponds to current practice for growth and development. As we have shown, preterms may look better in the first few months under full age-correction. If the focus of the scientific study is on the first few months, we recommend an age correction of \(f = 0.75\).