10.2 D-chart, a growth chart for child development
The field of child growth and development roughly divides into two areas:
- The subfield child growth (or auxology) emphasizes body measures like height, weight, body mass index, and so on. It is a rigorous quantitative science with intimate ties to statistics since the days of Quetelet and Galton.
- The subfield child development is more recent and builds upon a wide-ranging set of domain-specific instruments for measuring motor, language, cognitive and behavioural states.
The growth chart is a widely used tool to monitor physical growth. The D-score can be used in a similar way to create the D-chart.
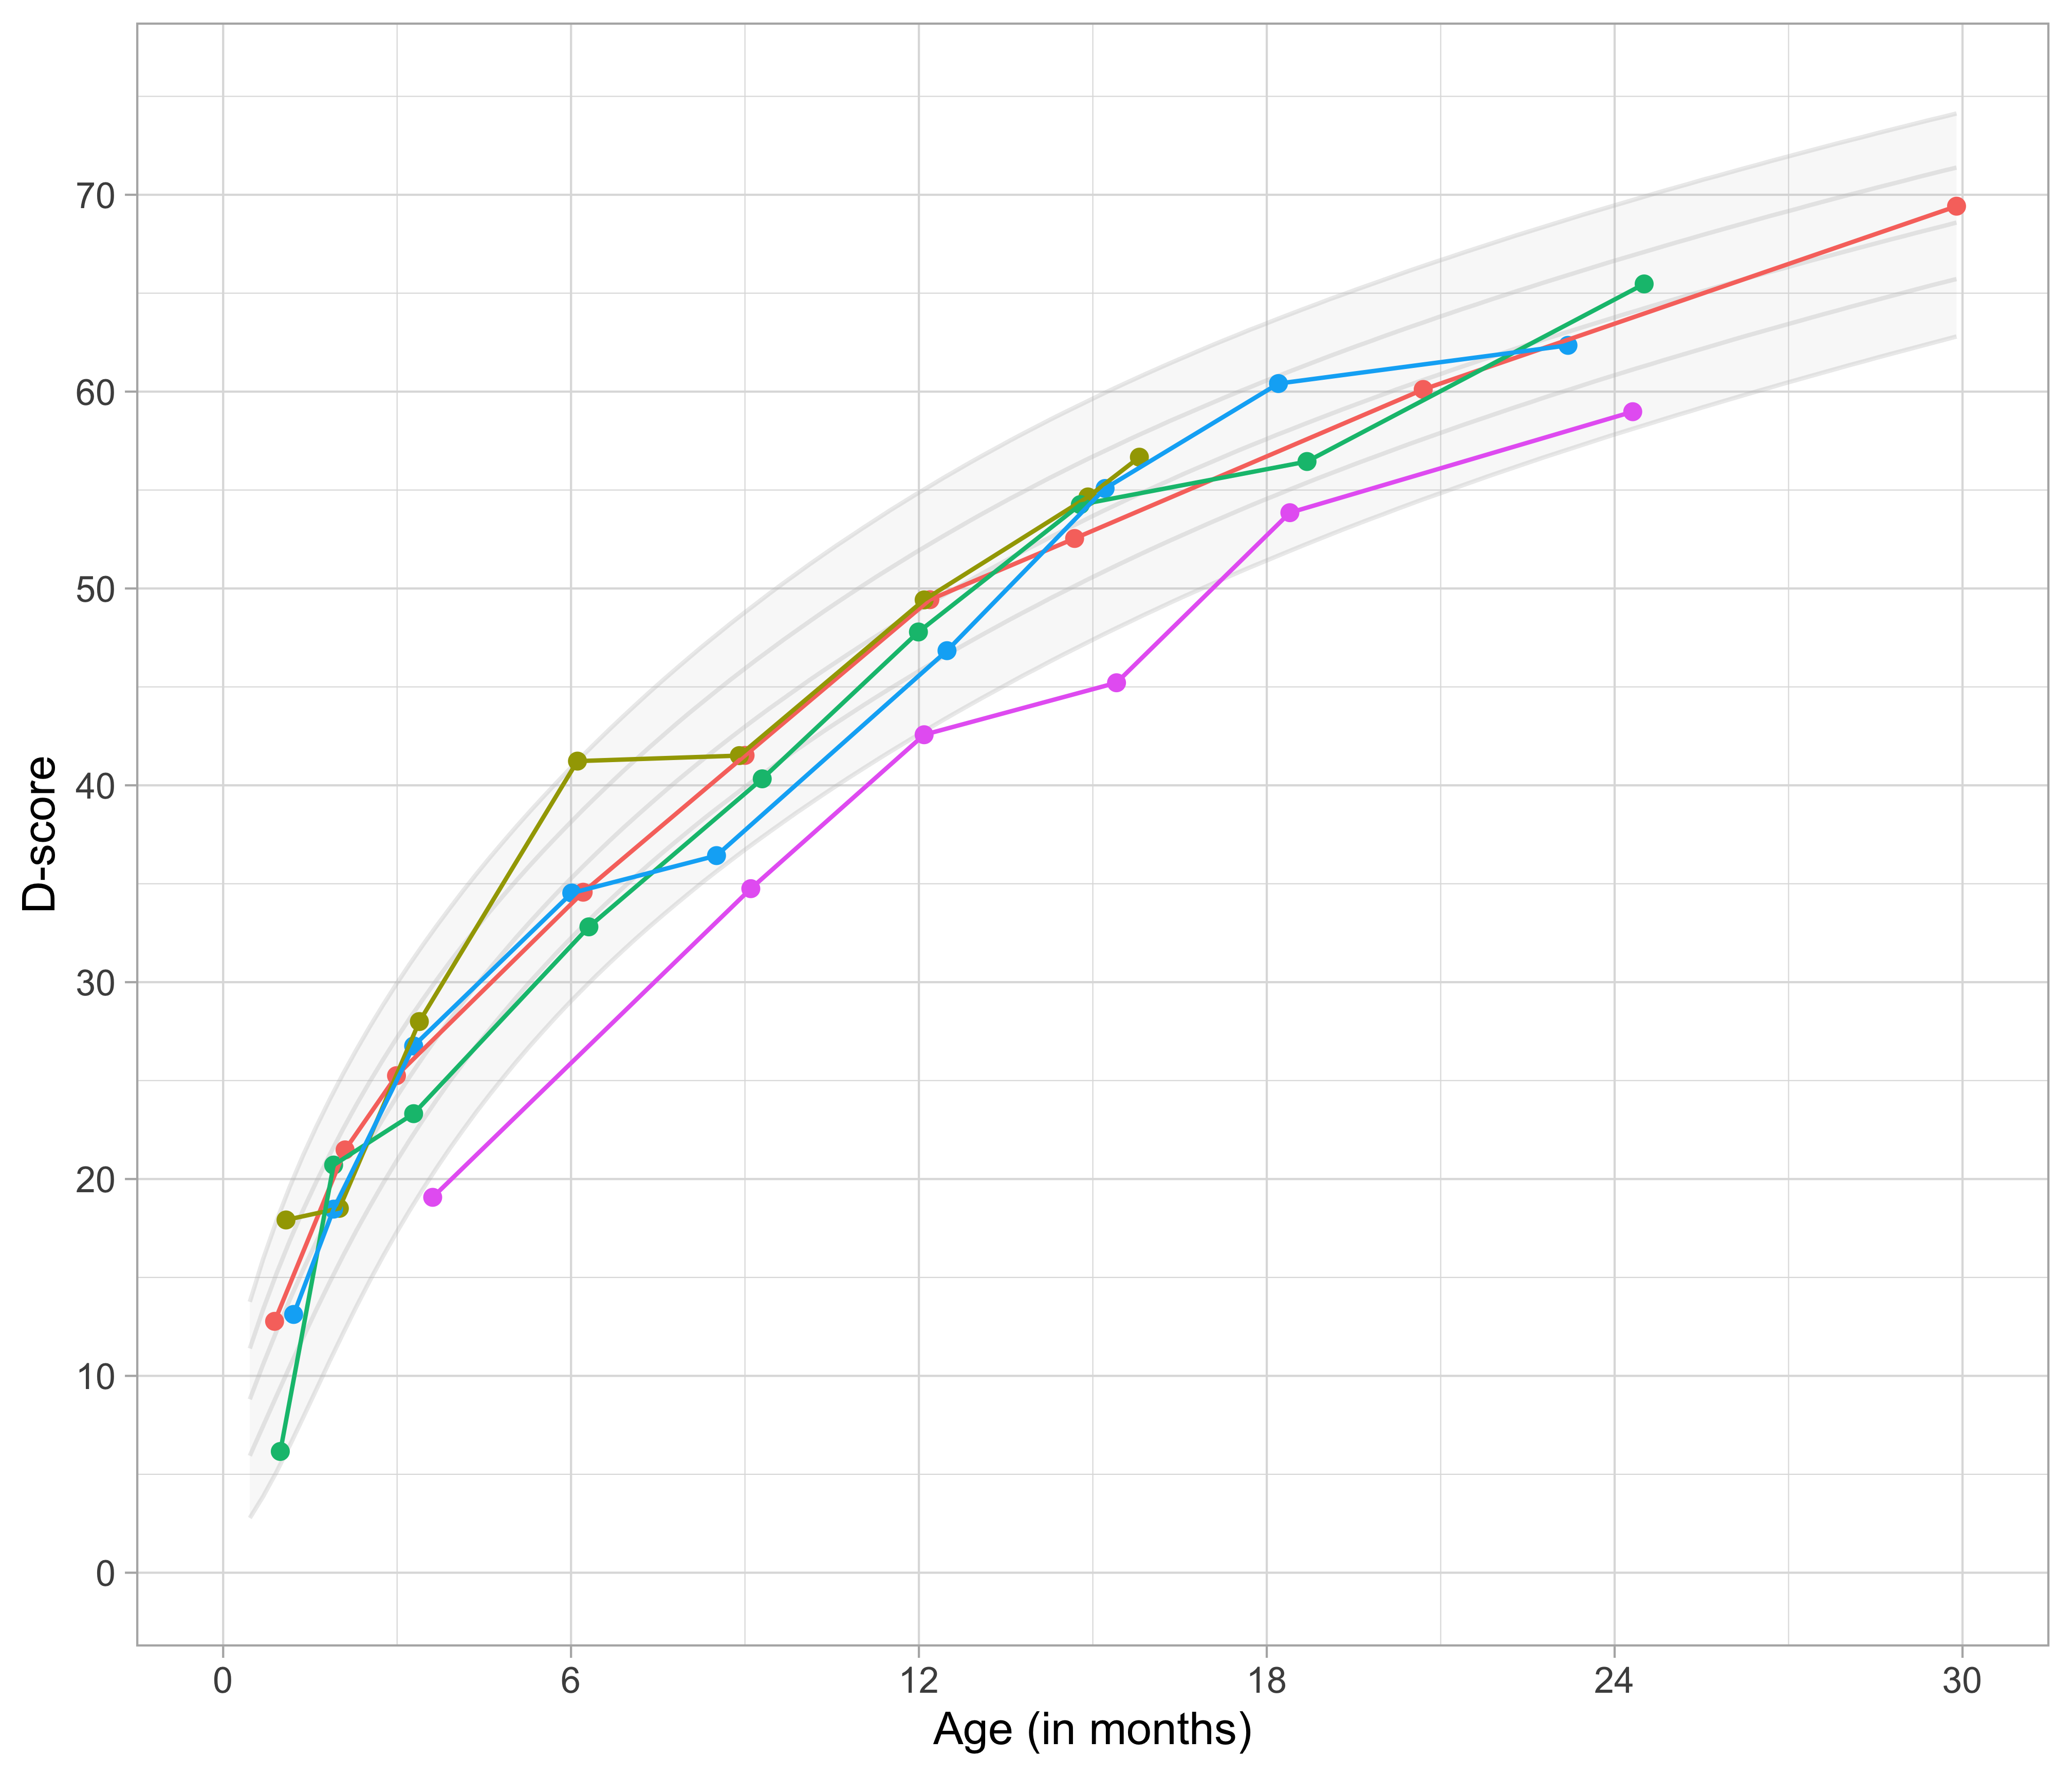
Figure 10.1: D-chart with five children from the SMOCC study.
Figure 10.1 shows the developmental paths of five randomly chosen children from the SMOCC study. Although the milestones differ across age, there is only one vertical axis. These trajectories will help to track the progress of a child over time.
The D-chart shows that it is straightforward to apply quantitative techniques from child growth to child development. Our hope is that D-score aids in bridging the disparate subfields of child growth and child development.