3.4 Unit-based measurement of development
3.4.1 Motivation for unit-based measurement
Unit-based measurement starts by defining ideal properties and derives a procedure to aggregate the responses on milestones into an overall score that will meet this ideal.
Section 2.4 highlighted questions for individuals, groups and populations. There are three questions:
- What is the difference in development over time for the same child, group or community?
- What is the difference in development between different children, groups or populations of the same age?
- How does child development compare to a norm?
In the ideal situation, we would like to have a continuous (latent) variable \(D\) (for development) that measures child development. The scale should allow us to quantify ability of persons, groups or populations from low to high. It should have a constant unit so that a given difference in ability refers to the same quantity across the entire scale. We find the same property in height, where a distance of 10 cm represents the same amount for molecules, people or galaxies. When are these conditions are met, we say that we measure on an interval scale.
If we succeed in creating an interval scale for child development, an enormous arsenal of techniques developed for quantitative variables opens up to measure, track and analyze child development. We may then evaluate the status of a child in terms of \(D\) points gained, create age-dependent diagrams (just like growth charts for height and weight), devise age-conditional measures for child development, and intelligent adaptive testing schemes. Promising studies on Dutch data van Buuren (2014) suggest that such benefits are well within reach.
3.4.2 Example of unit-based measurement
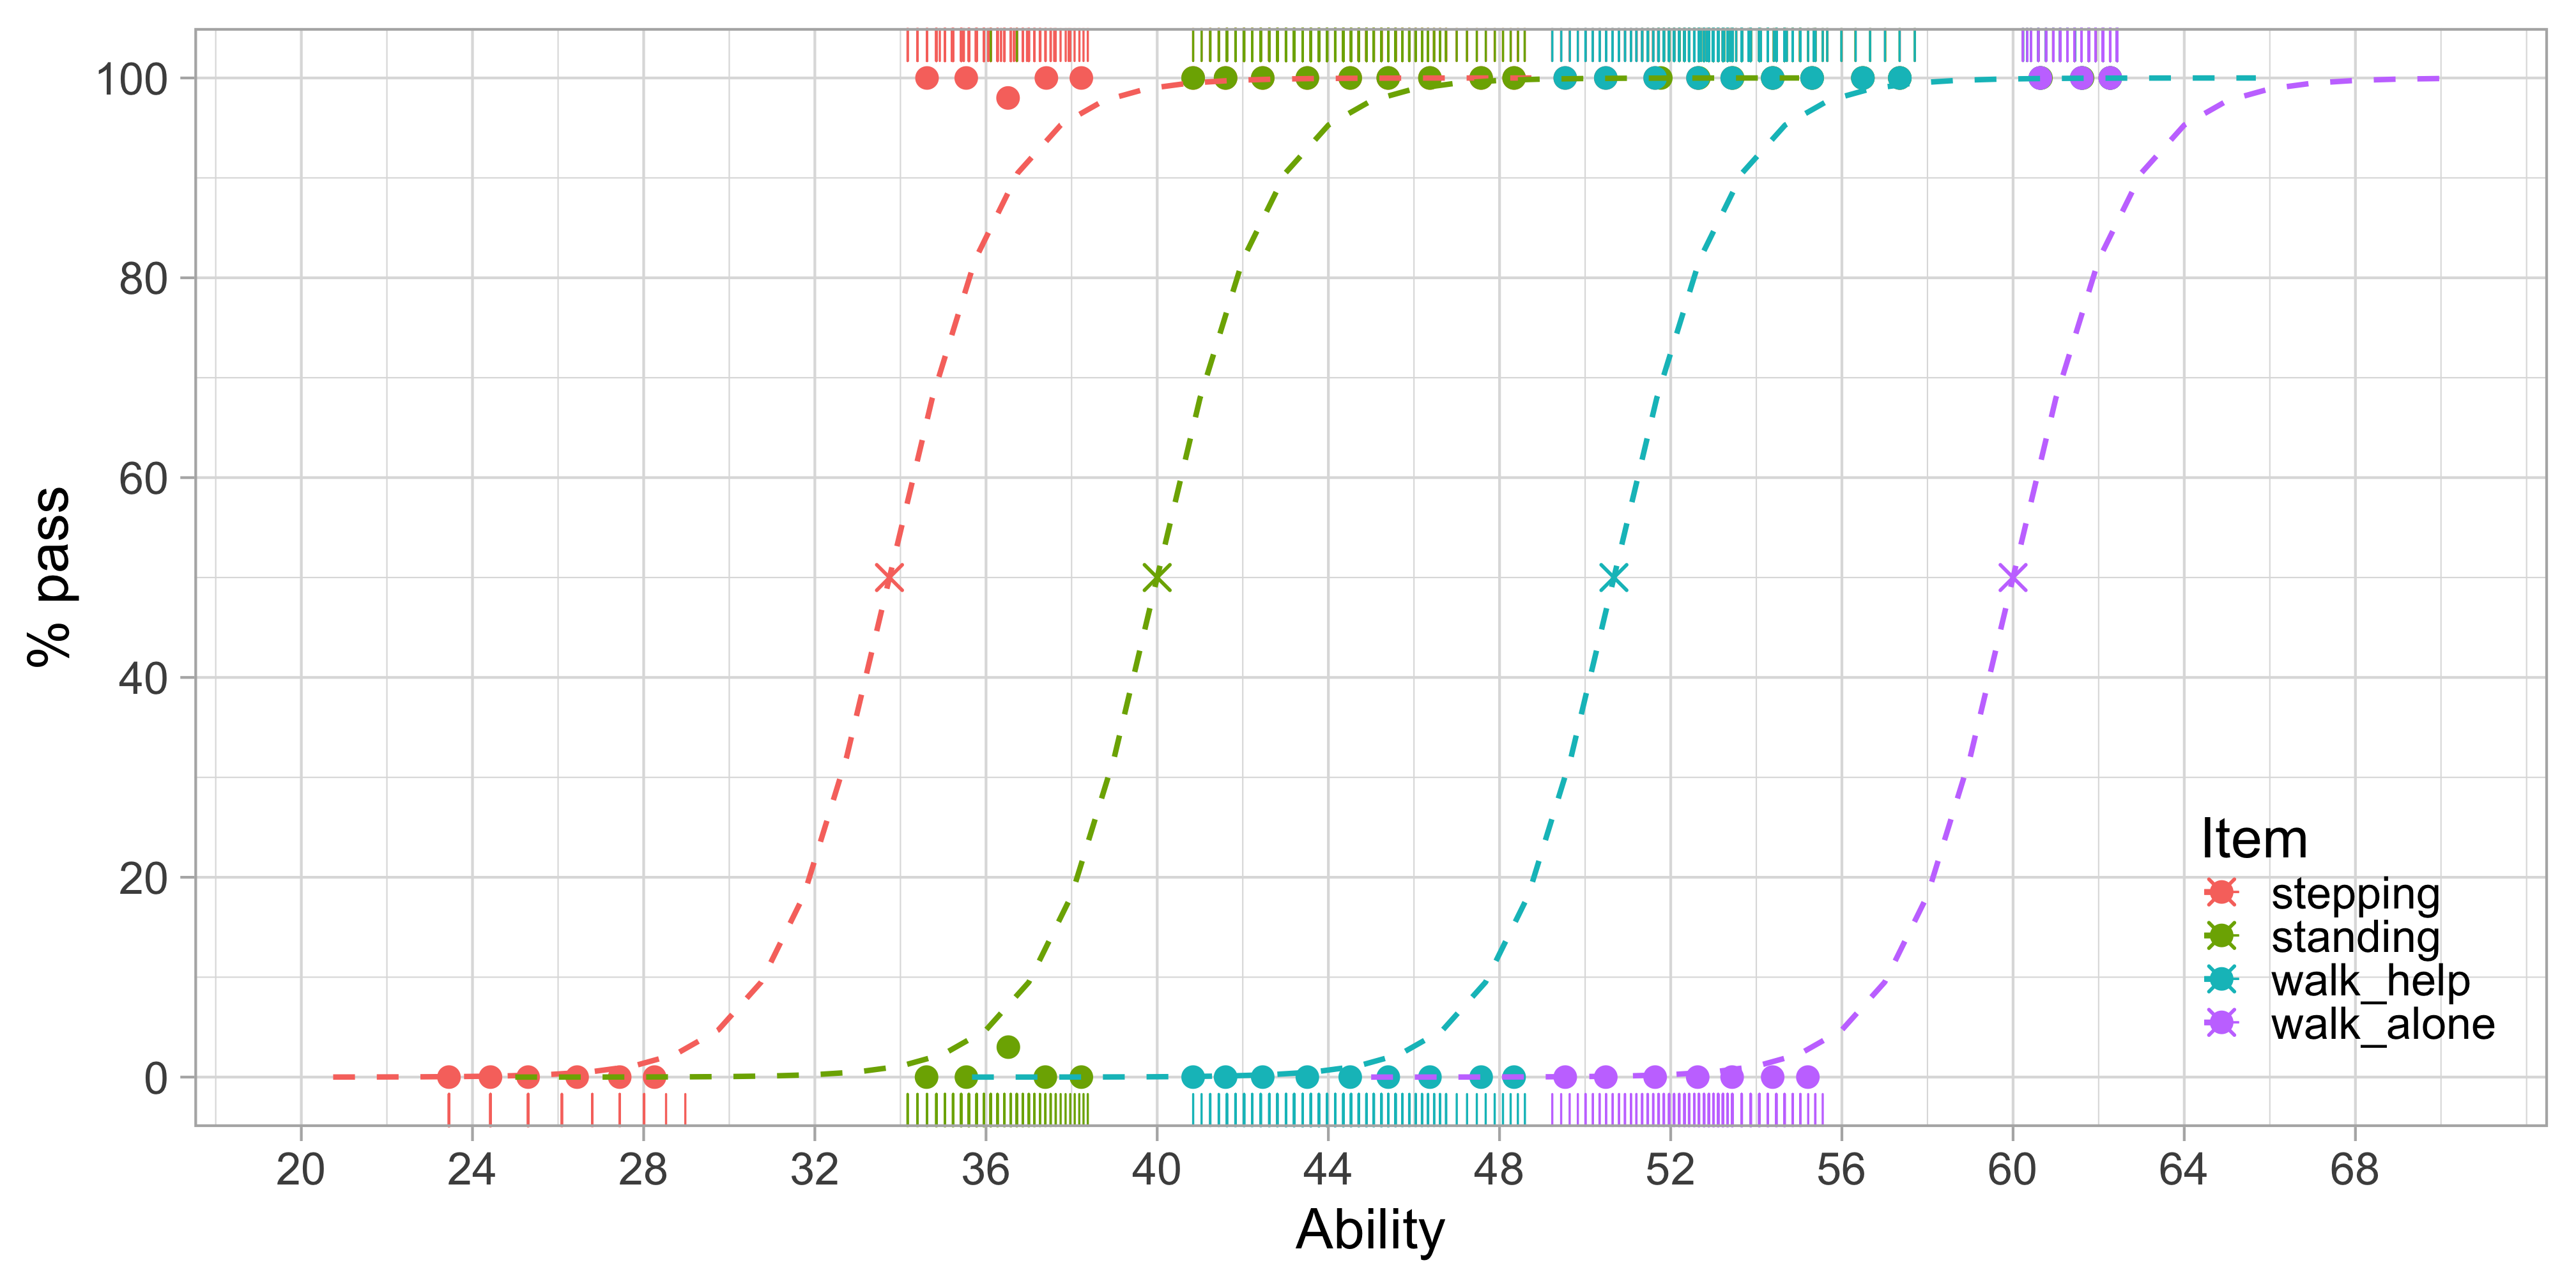
Figure 3.5: Modeled probability of achieving four motor milestones against the D-score.
Figure 3.5 is similar to Figure 3.3, but with Age replaced by Ability. Also, modelled curves have replaced empirical ones, but this is not essential.
We estimated the ability values on the horizontal axis from the data. The values correspond to the amount of development of each visit. Likewise, we calculated the logistic curves from the data. These reflect the probability of passing each milestone at a given level of ability.
Figure 3.5 shows that the probability of passing a milestone increases with ability. Items are sorted according to difficulty from left to right. Milestone stepping is the easiest and walk_alone is the most difficult. The point at which a logistic curve crosses the 50 per cent line (marked by a cross) is the difficulty of the milestone.
The increase in ability that is needed to go from 10 to 90 per cent is about five units here. Since all curves are parallel, the interval is constant for all scale locations. Thus, the scale is an interval scale with a constant unit of measurement, the type of measurement needed for answering the basic questions identified in Section 3.4.1.
3.4.3 Limitations of unit-based measurement
While unit-based measurement has many advantages, it cannot perform miracles.
- An important assumption is that the milestones “measure the same thing,” or put differently, are manifestations of a continuous latent variable that can be measured by empirical observations. Unit-based measurement won’t work if there is no sensible latent scale.
- The portrayed advantages hold only if the discrepancies between the data and the model are relatively small. Since the simplest and most powerful measurement models are strict, it is essential to obtain a good fit between the data and the model.
- The construction of unit-based measurement requires psychometric expertise, specialized computer software and considerable sample sizes.