9.3 TOGO study
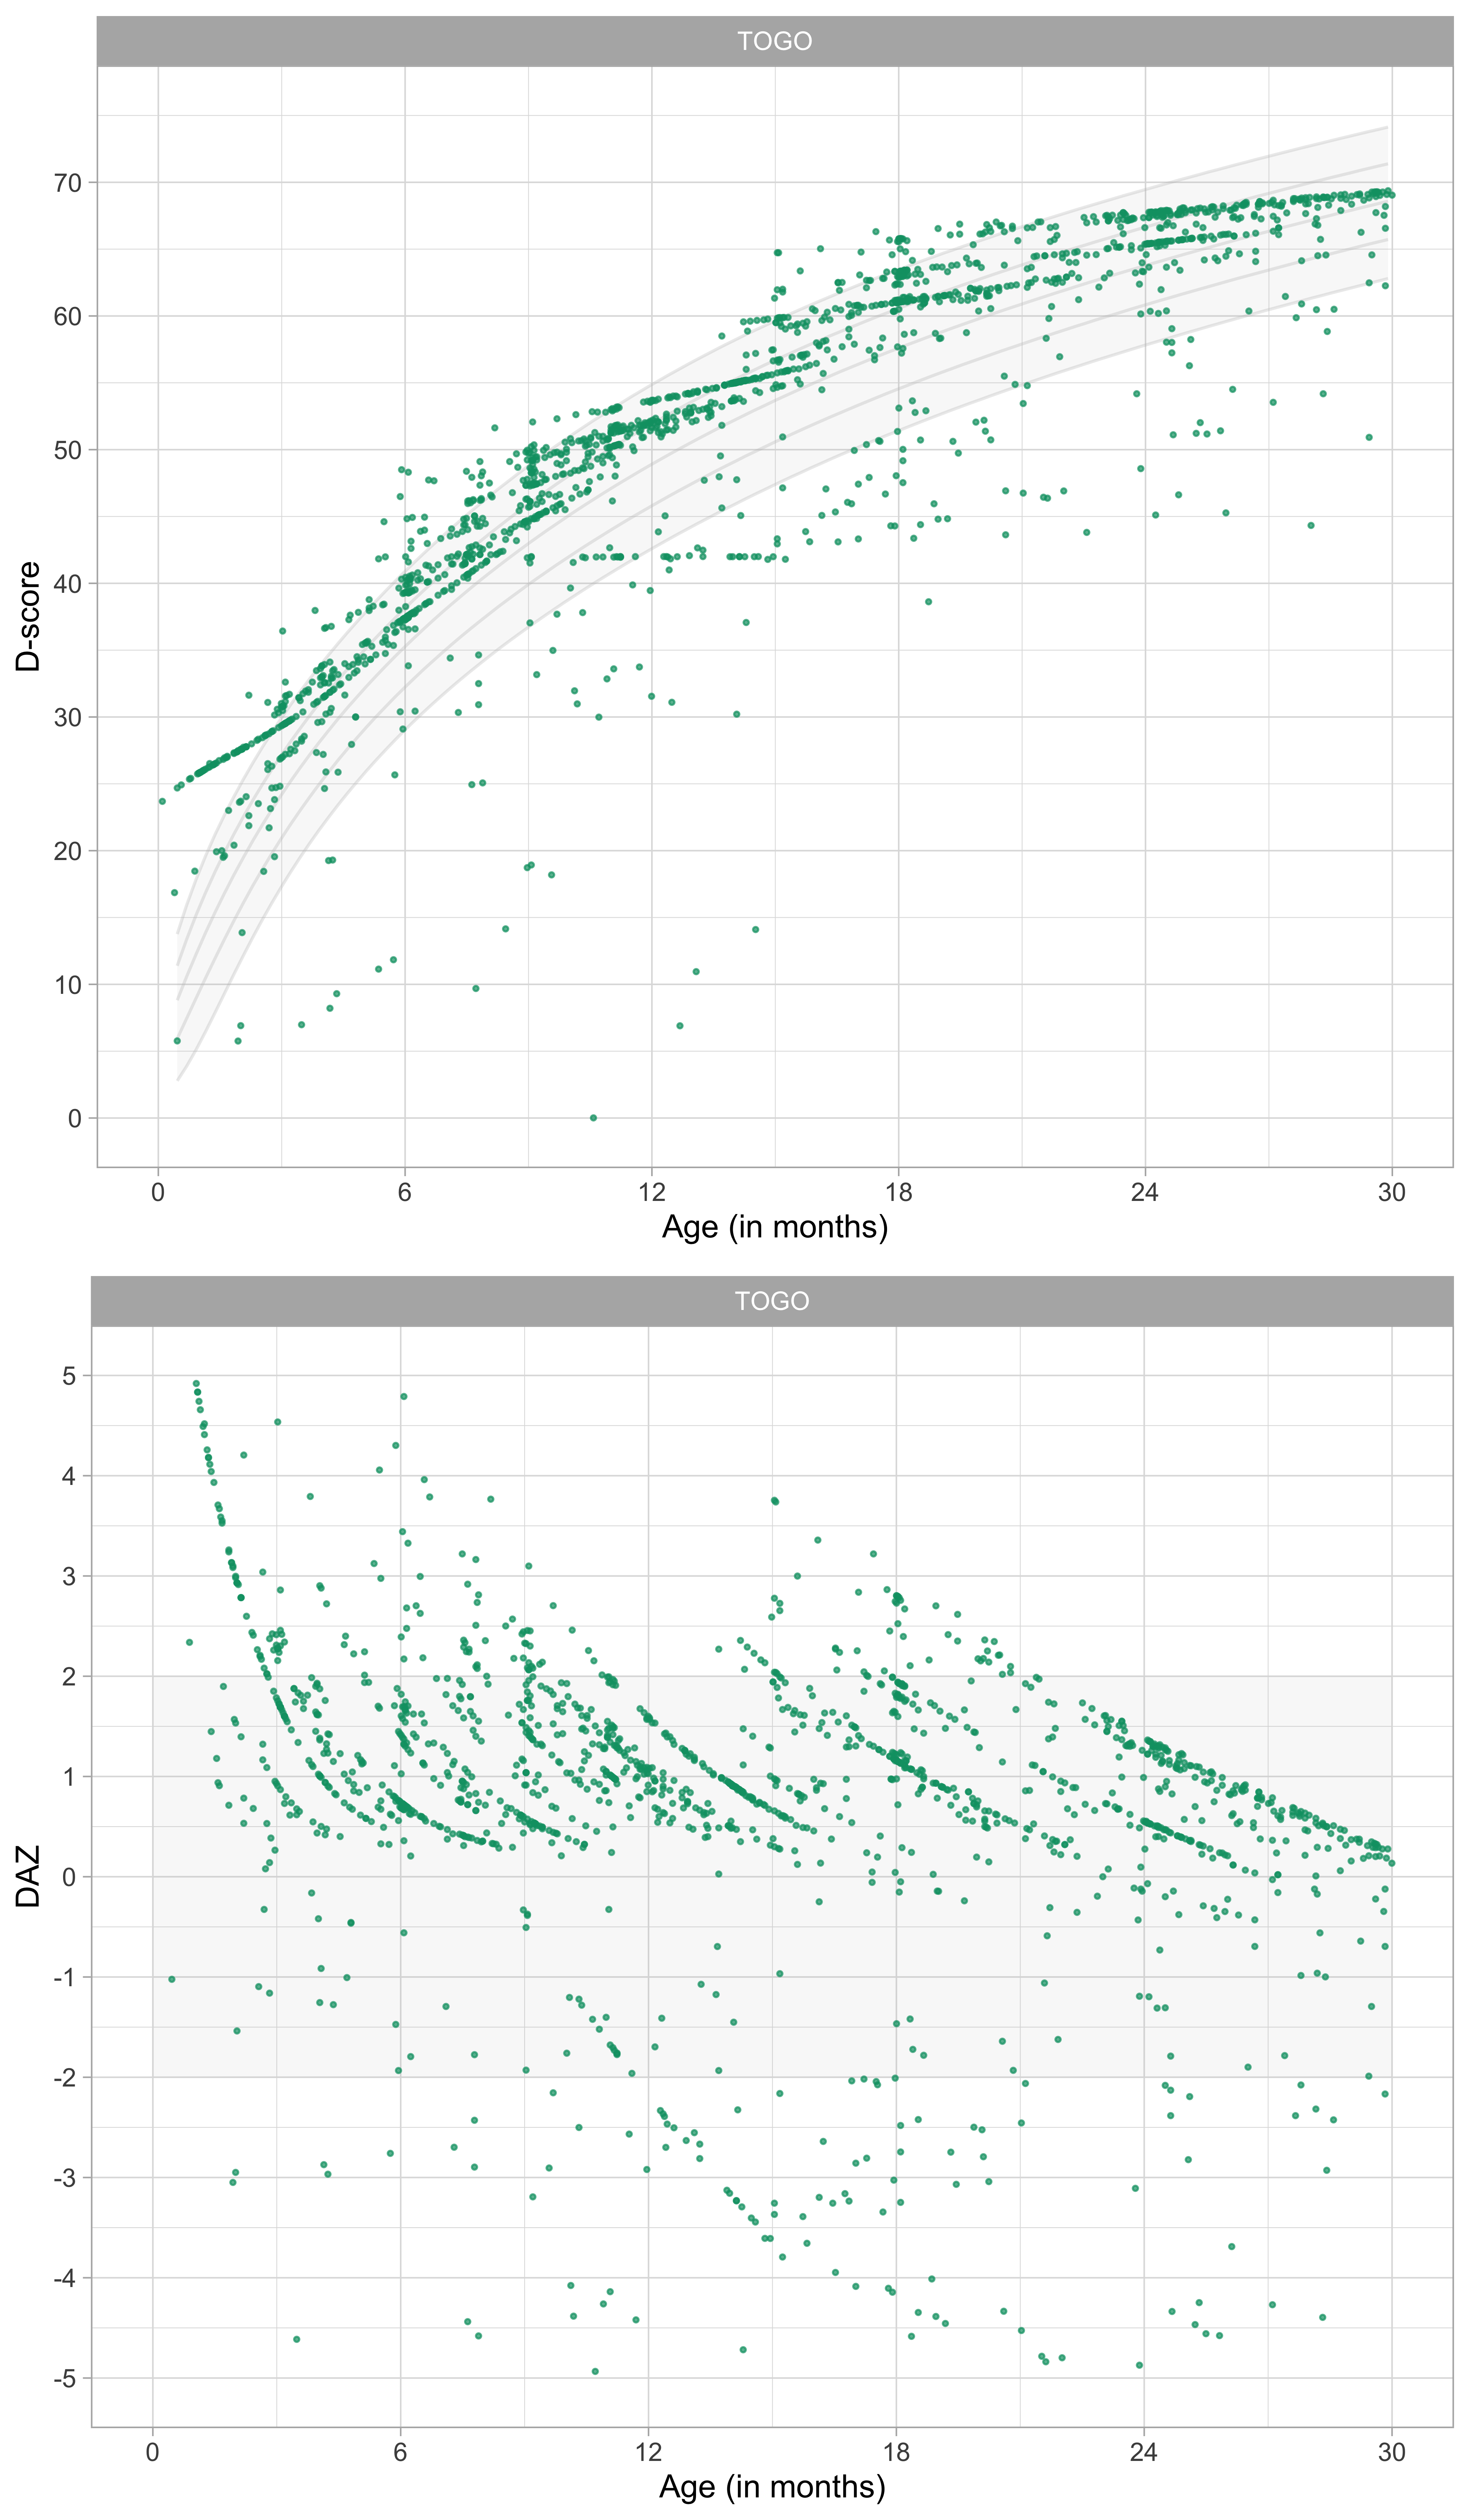
Figure 9.6: Distribution of D-score and DAZ by child age of children living near Kpalimé, Togo (Source: TOGO data, \(n = 1567\)).
Figure 9.6 presents the D-score and DAZ distributions of a sample of children living near Kpalimé, Togo. While the primary trend with age conforms to the previous data, the distributions differ from those in Figures 9.1 and 9.2 in two respects:
- Compression at the upper end: Most of the D-scores are above the median curve, which suggests that, at these ages, children living in Togo develop faster than children living in the Netherlands;
- Expansion at the lower end: There is a considerable variation in D-scores on the lower end, with many D-scores below the -2 SD curve, suggesting that some children are significantly more delayed than would be expected in both Dutch samples.
The D-scores are calculated using the same 57 milestones and difficulty estimates as before. The resulting D-score distribution is quite unusual. The main question here is what could explain the pattern found in the D-scores. This section explores this question in some detail.
9.3.1 Togo Kpalimé study, design
If the D-score is to be a universal measure, then it should be informative in low and middle-income countries (LMIC) as well. We do not yet know much about the usability and validity of the D-score in LMIC’s. The western African country of Togo qualifies as a low-income country, with a 2017 GNI per capita of USD 610, compared to USD 46,180 in the Netherlands, and USD 744 for low-income countries in general (data.worldbank.org).
The data were collected by Cécile Schat-Savy, who initiated a youth health care centre modelled after the Dutch youth health care system in Kpalimé, Togo. See https://www.kinderhulp-togo.nl for more background. Data monitoring included a french translation the DDI for measuring child development. The investigators gathered data from 9747 individuals in the 0-18 age range.
Participants include children and their parents who visited the Kpalimé health centre at least one time. Kpalimé is the fourth largest town in Togo, but the health centre also attracted parents and children from a wide surrounding rural area. Parents visited the health centre for several reasons, including for a preventive health check or because of their child’s apparent health problems.
The health centre targeted parents through information sessions for parents at primary schools. Parents paid a small amount of money per child (about USD 4.00 for children of 4 years or older, and USD 0.80 for children younger than four years). Four local data-assistants, some portrayed on Figure 9.7, digitized the data from paper archives. TNO Child Health in The Netherlands monitored the process and checked the data for completeness and consistency.

Figure 9.7: Three of the data-assistants who helped to digitize the paper files. Reproduced with permission from Stichting Kinderhulp Togo https://www.kinderhulp-togo.nl.
Here we use a subset of 2674 visits from 1644 unique children who scored on the 57 milestones of the DDI 0-2 years. We did not calculate D-scores when age or DDI milestones were missing, which left a dataset of 2425 visits from unique 1567 children. The number of visits varied from 1 – 9. The majority of children visited the centre once.
9.3.2 D-score labelled by neurological problem
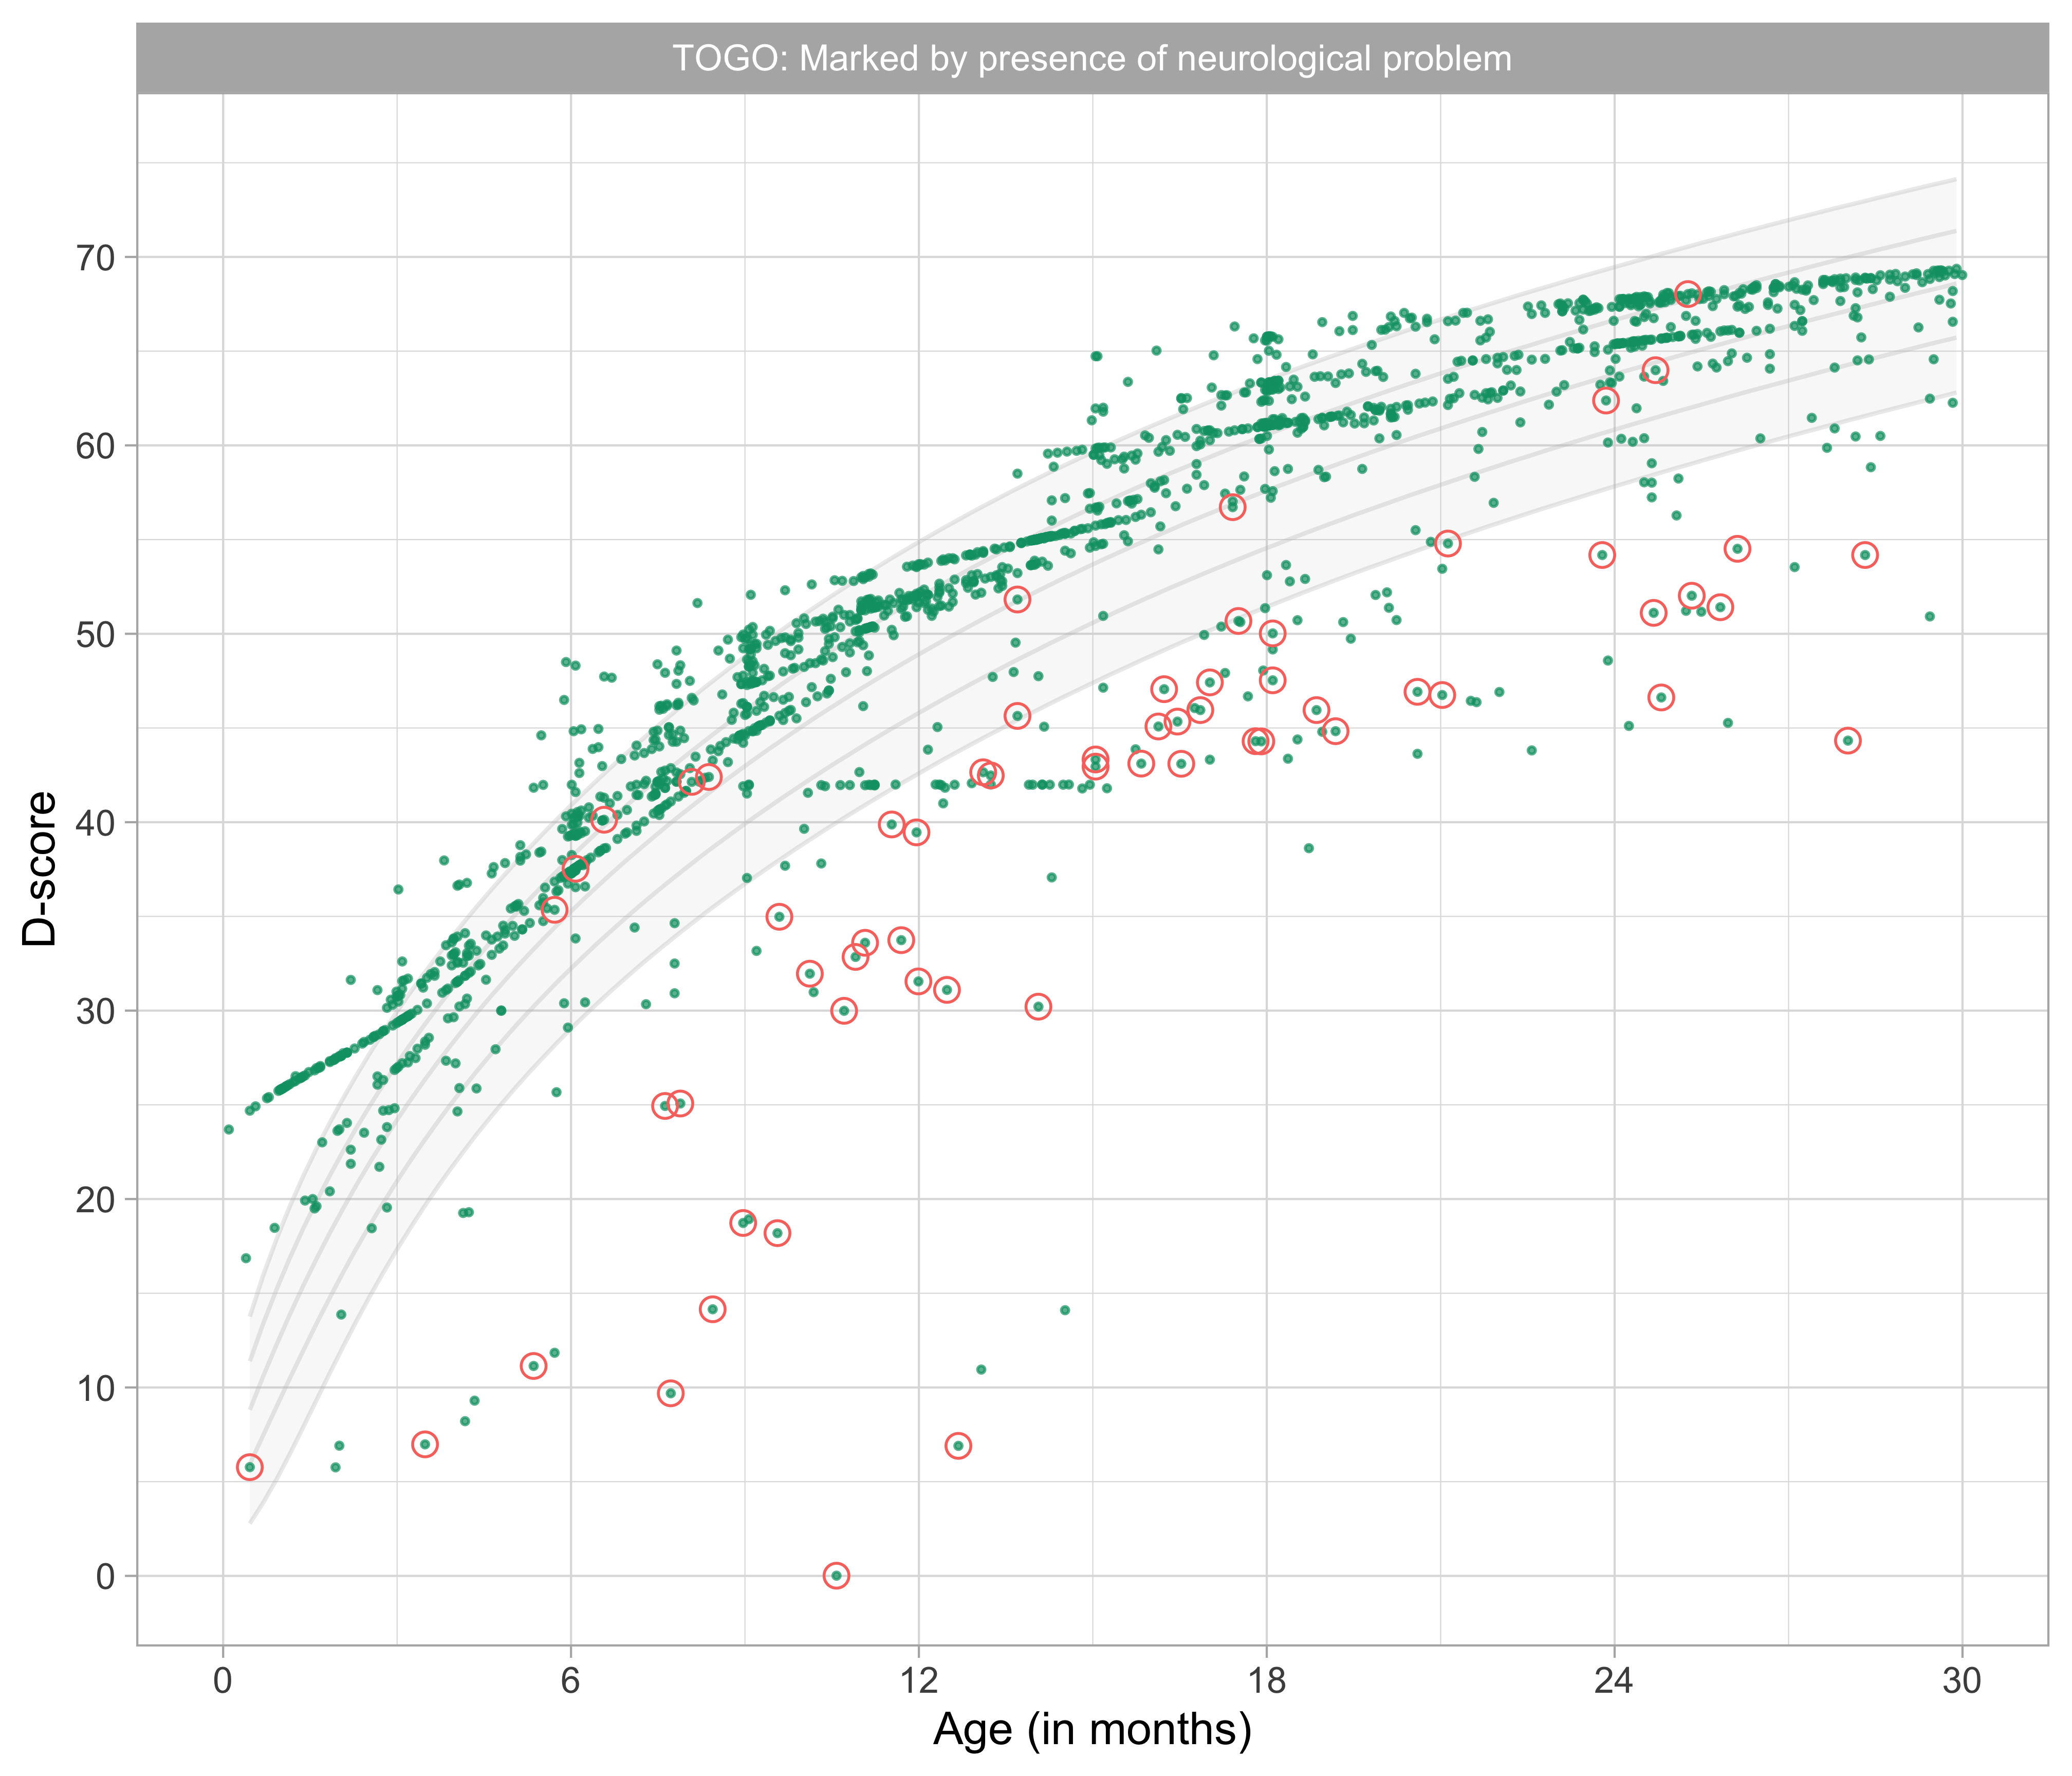
Figure 9.8: Distribution of D-score by age labelled by neurological (tonus and/or reflex) problems. (Source: TOGO data).
Figure 9.8 is the same scatter plot as in Figure 9.6, but now marked by whether the physician registered signs of neuropathology in the form of tonus and reflex problems.
Many children with low D-scores also have tonus or reflex problems. This finding alone suggests that extreme D-score are not artefacts (e.g. caused by a wrongly coded age), but indicate main adverse health conditions.
9.3.3 D-score labelled by Apgar score
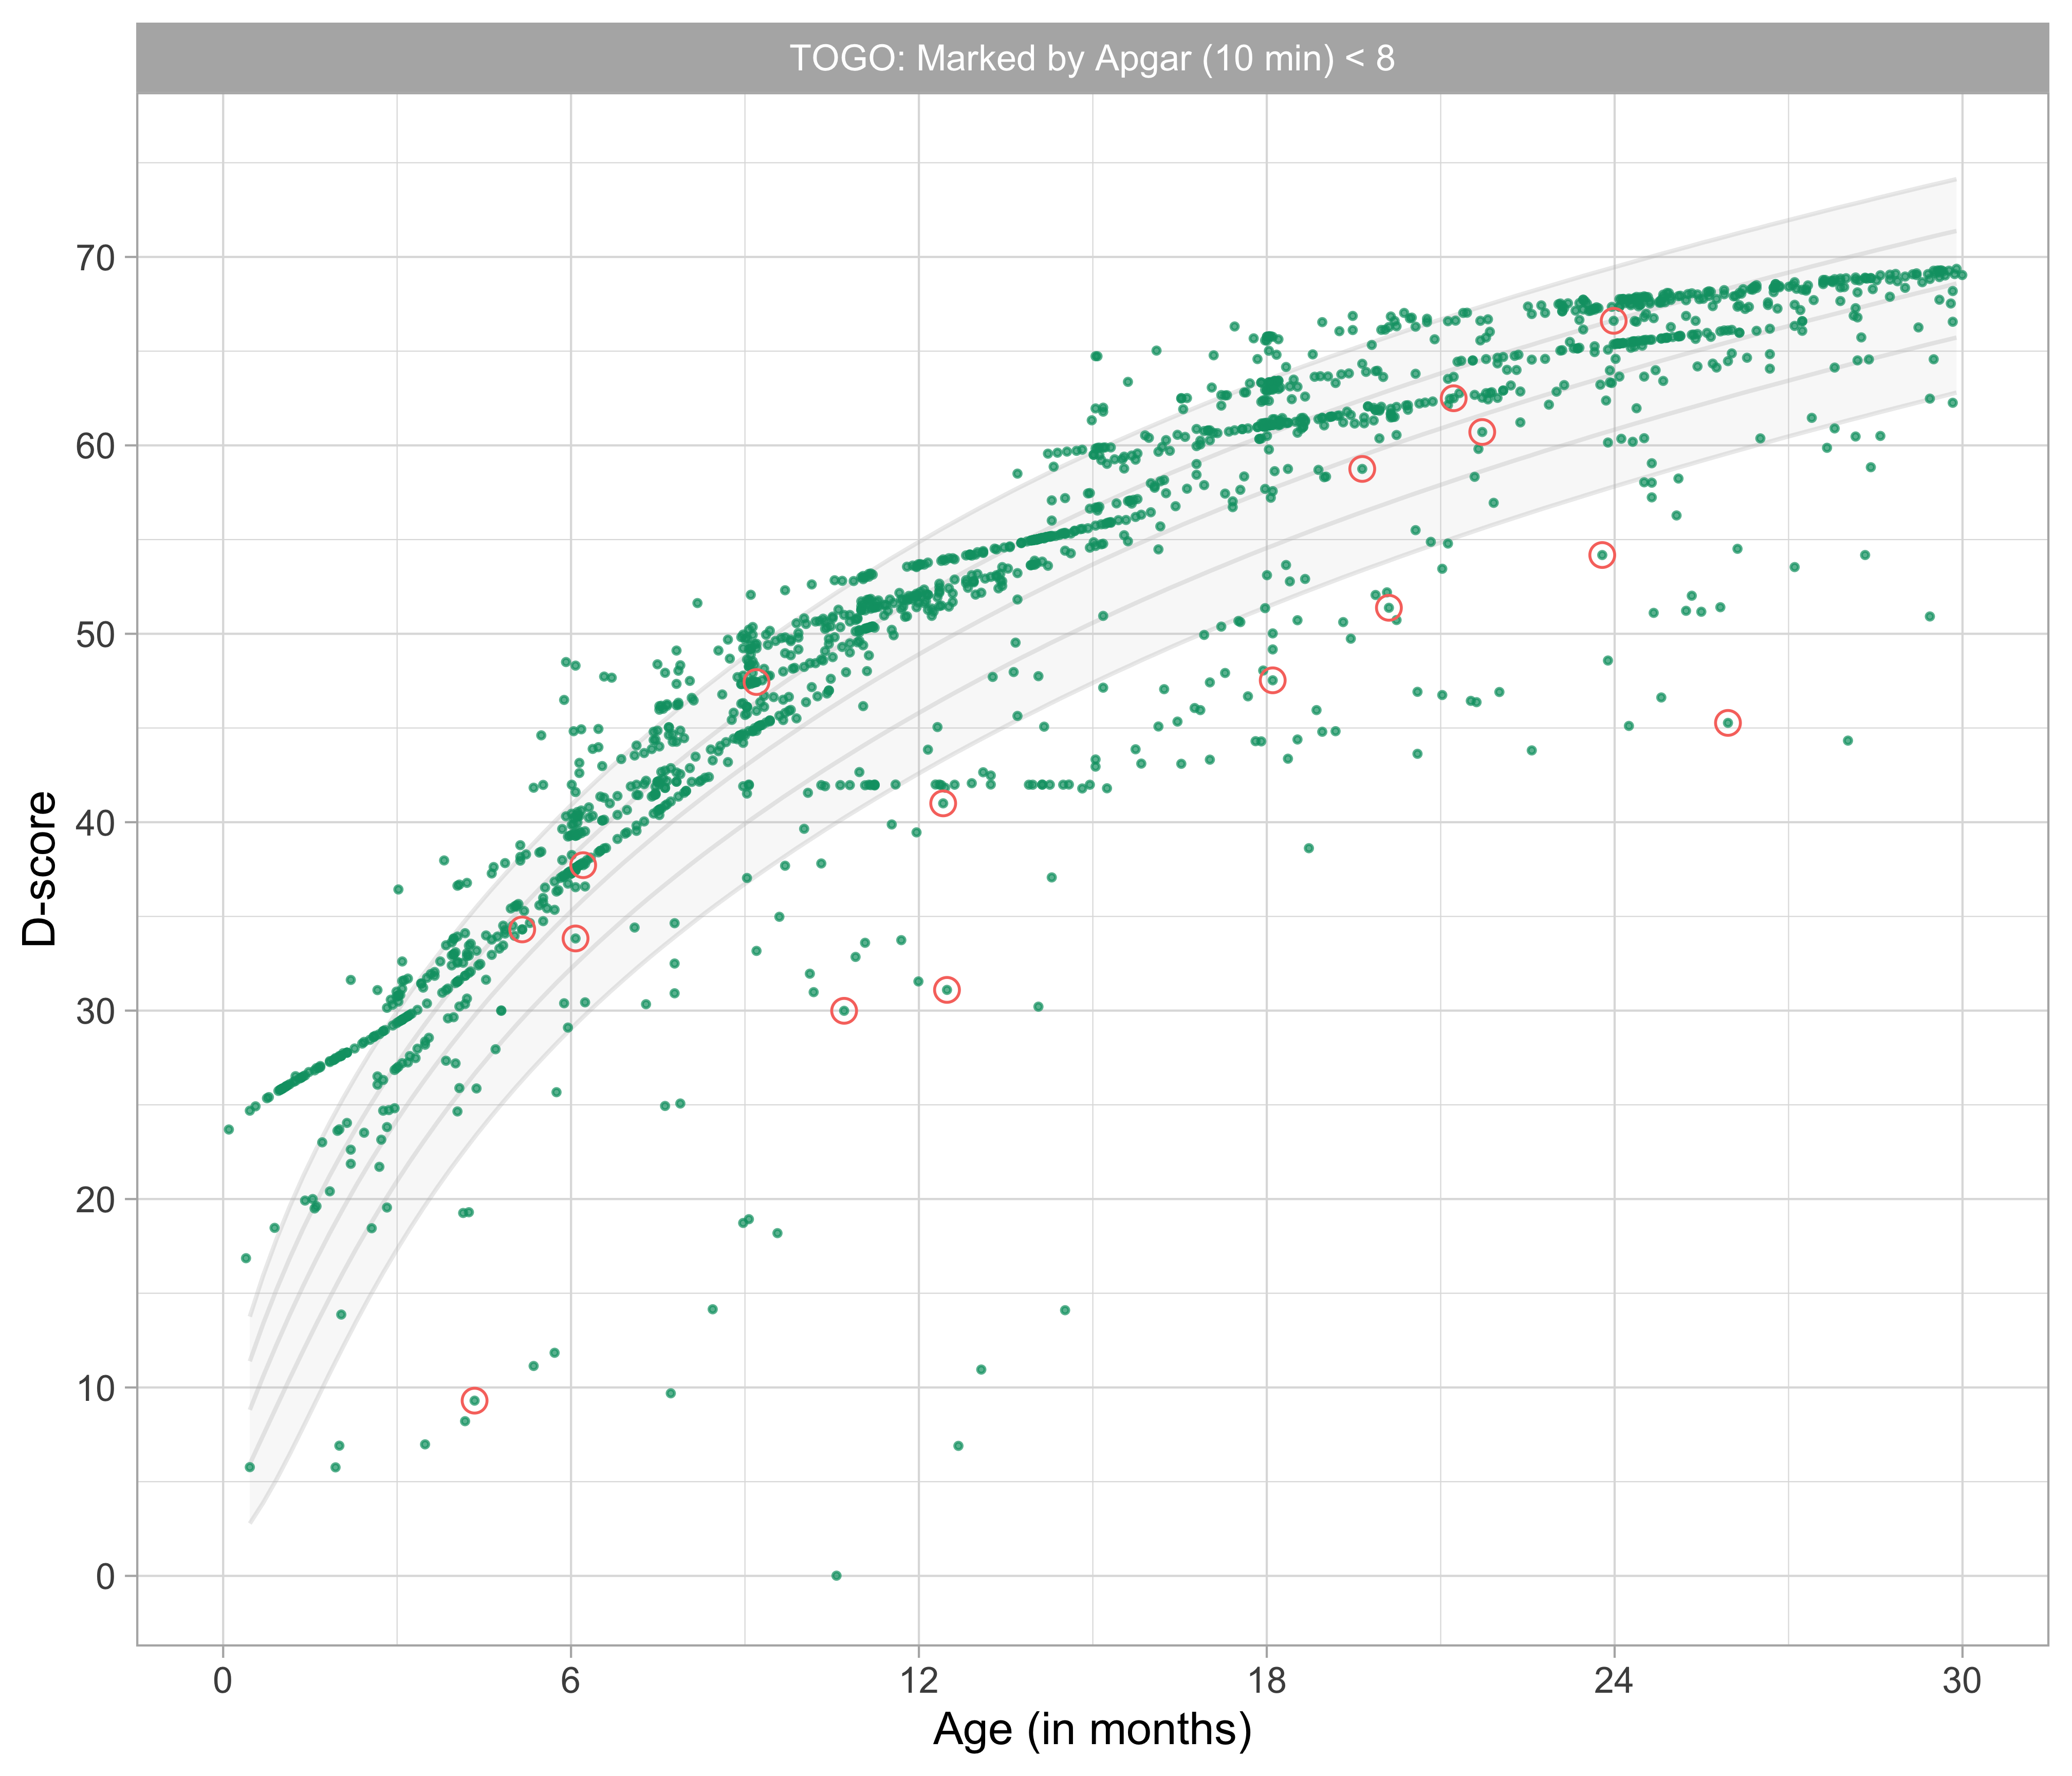
Figure 9.9: Distribution of D-score by age labelled by Apgar score (10 minutes) lower than 8. (Source: TOGO data).
Figure 9.9 identifies the children who had an Apgar score at 10 minutes after birth that was lower than 8. About half of these children had a D-score below -2 SD curve.
9.3.4 D-score labelled by severe underweight

Figure 9.10: Distribution of D-score by age labelled by severe underweight (WAZ < -4) (Source: TOGO data).
Many children who visited the Kpalimé health centre had a low body weight for their age. Figure 9.10 marks the subset of severely underweight children (WAZ < -4). A substantial proportion of these children also had a very low D-score.
9.3.5 D-score labelled by severe stunting
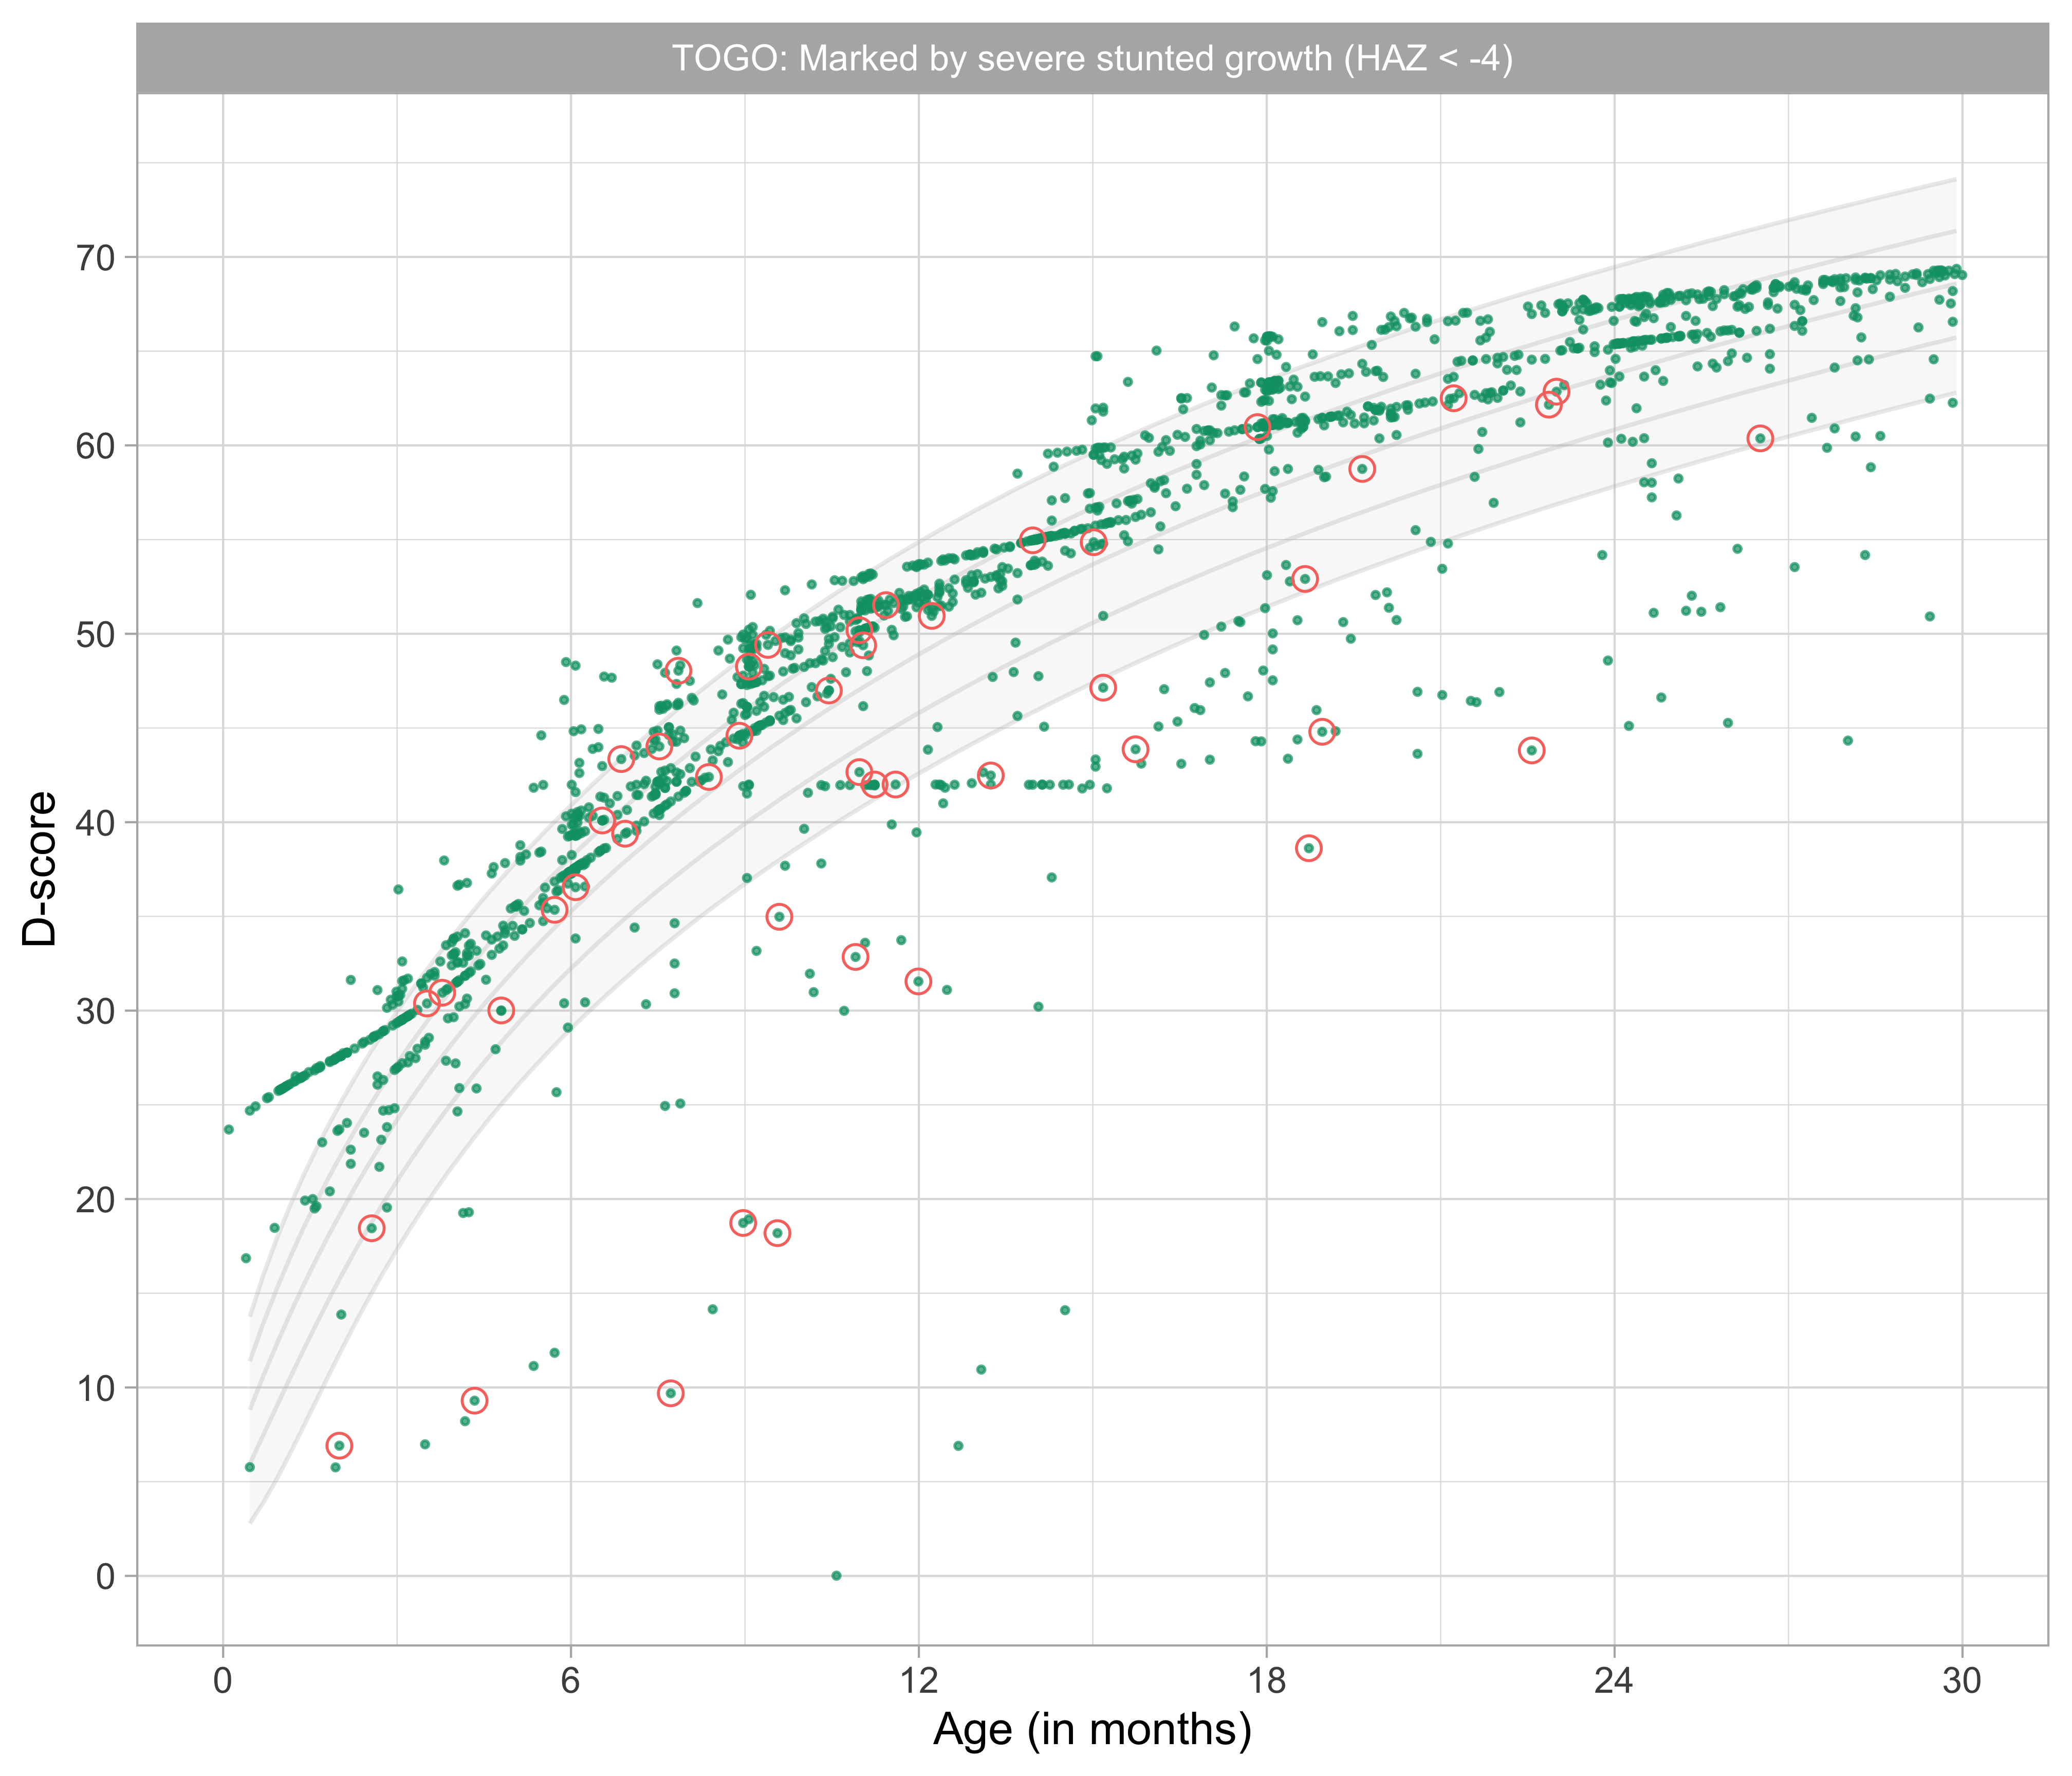
Figure 9.11: Distribution of D-score by age labelled by severe stunting (HAZ < -4) (Source: TOGO data).
Figure 9.11 is similar to 9.10, but now marked by the subset of severely stunted children (HAZ < -4). Also here, a sizable proportion has a low D-score.
When taken together, Figures 9.8-9.11 show that children with very low D-scores often experience (multiple) harsh health problems. Those health problems may have substantially delayed their development.
9.3.6 Gross motor development
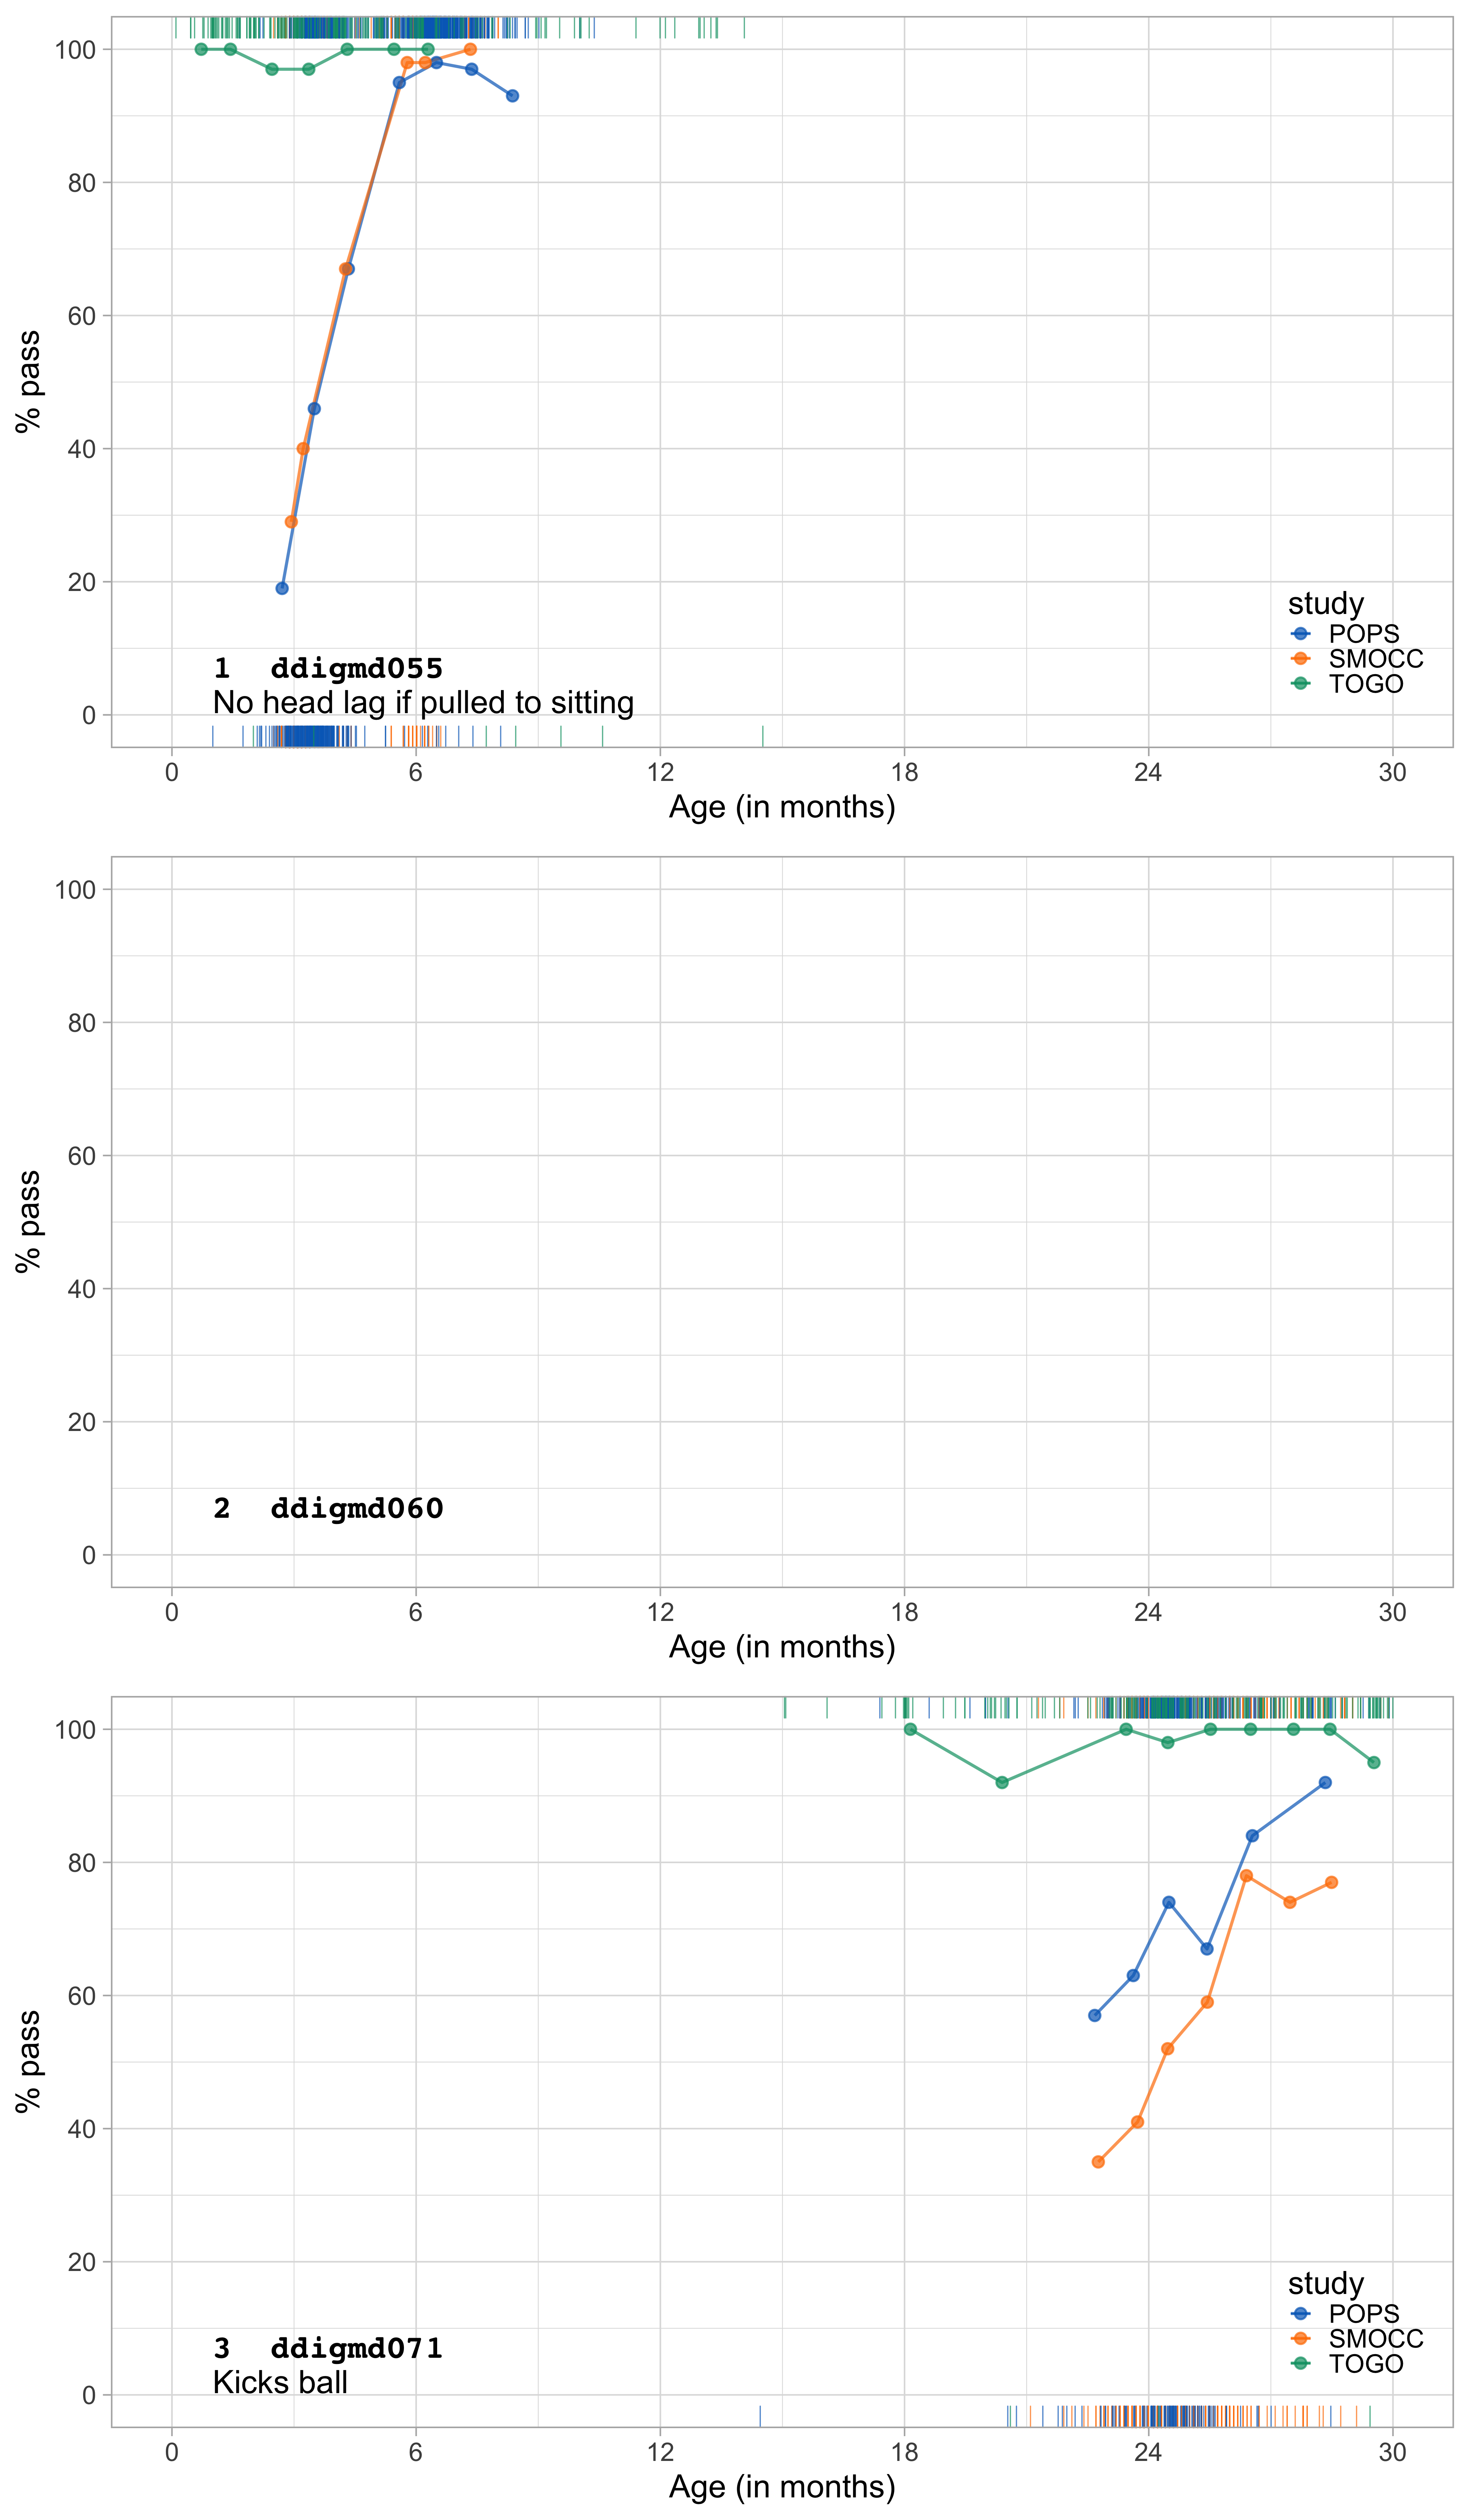
Figure 9.12: Gross motor milestones. Probability by age for SMOCC, POPS (corrected age) and TOGO studies for three milestones.
Figure 9.12 shows substantial differences in gross motor development between children from Togo and the Netherlands. For example, at the age of three months, about 30 per cent of the Dutch infants succeed in controlling their head when pulled to sitting. However, infants from Togo seem already capable of head control when they are just one month old.
Moreover, the advantage persists at least until up to the age of two years: children in Togo can roll over and sit much earlier, or kick a ball without falling. As the documentary Babies shows, African children even manage to learn to walk with a tin can on their head, a craft that children in the west never achieve.
9.3.7 Fine motor development
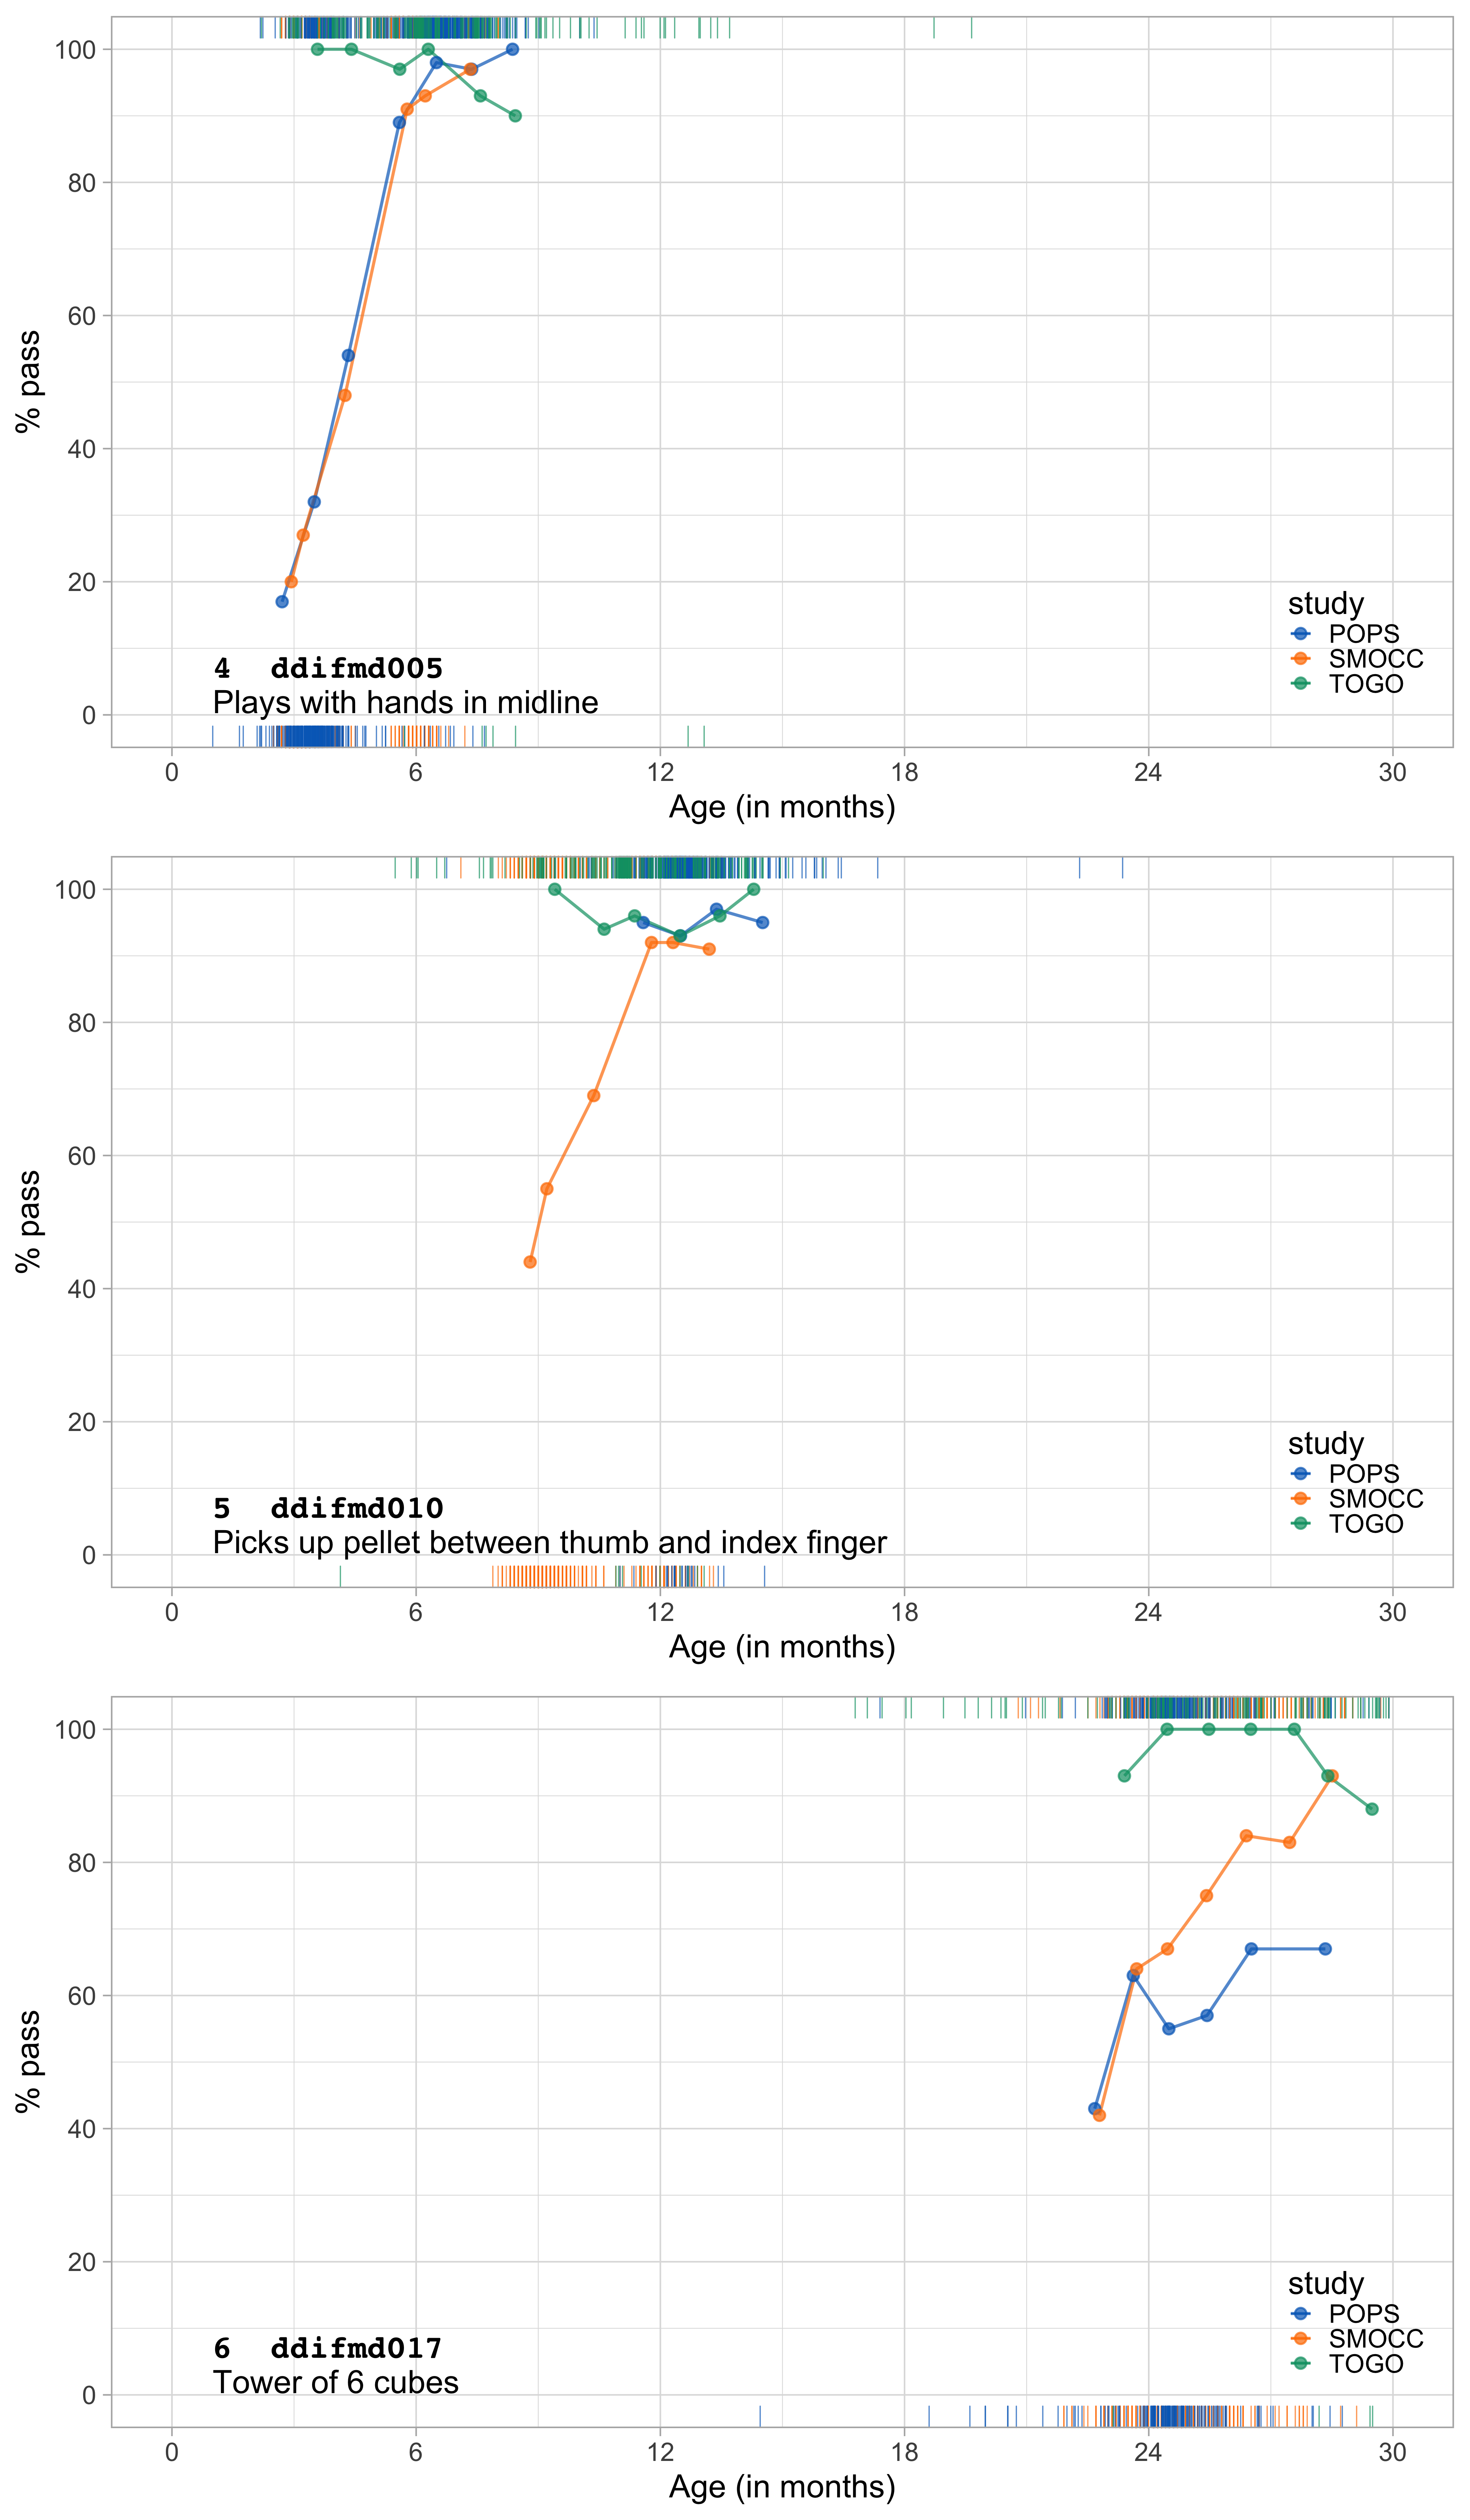
Figure 9.13: Fine motor milestones. Probability by age for SMOCC, POPS (corrected age) and TOGO studies for three milestones.
Figure 9.13 shows a less pronounced but similar phenomenon for fine motor skills. These data suggest that children in Togo may have better fine motor skills than the children from the two Dutch cohorts.
9.3.8 Communication and language
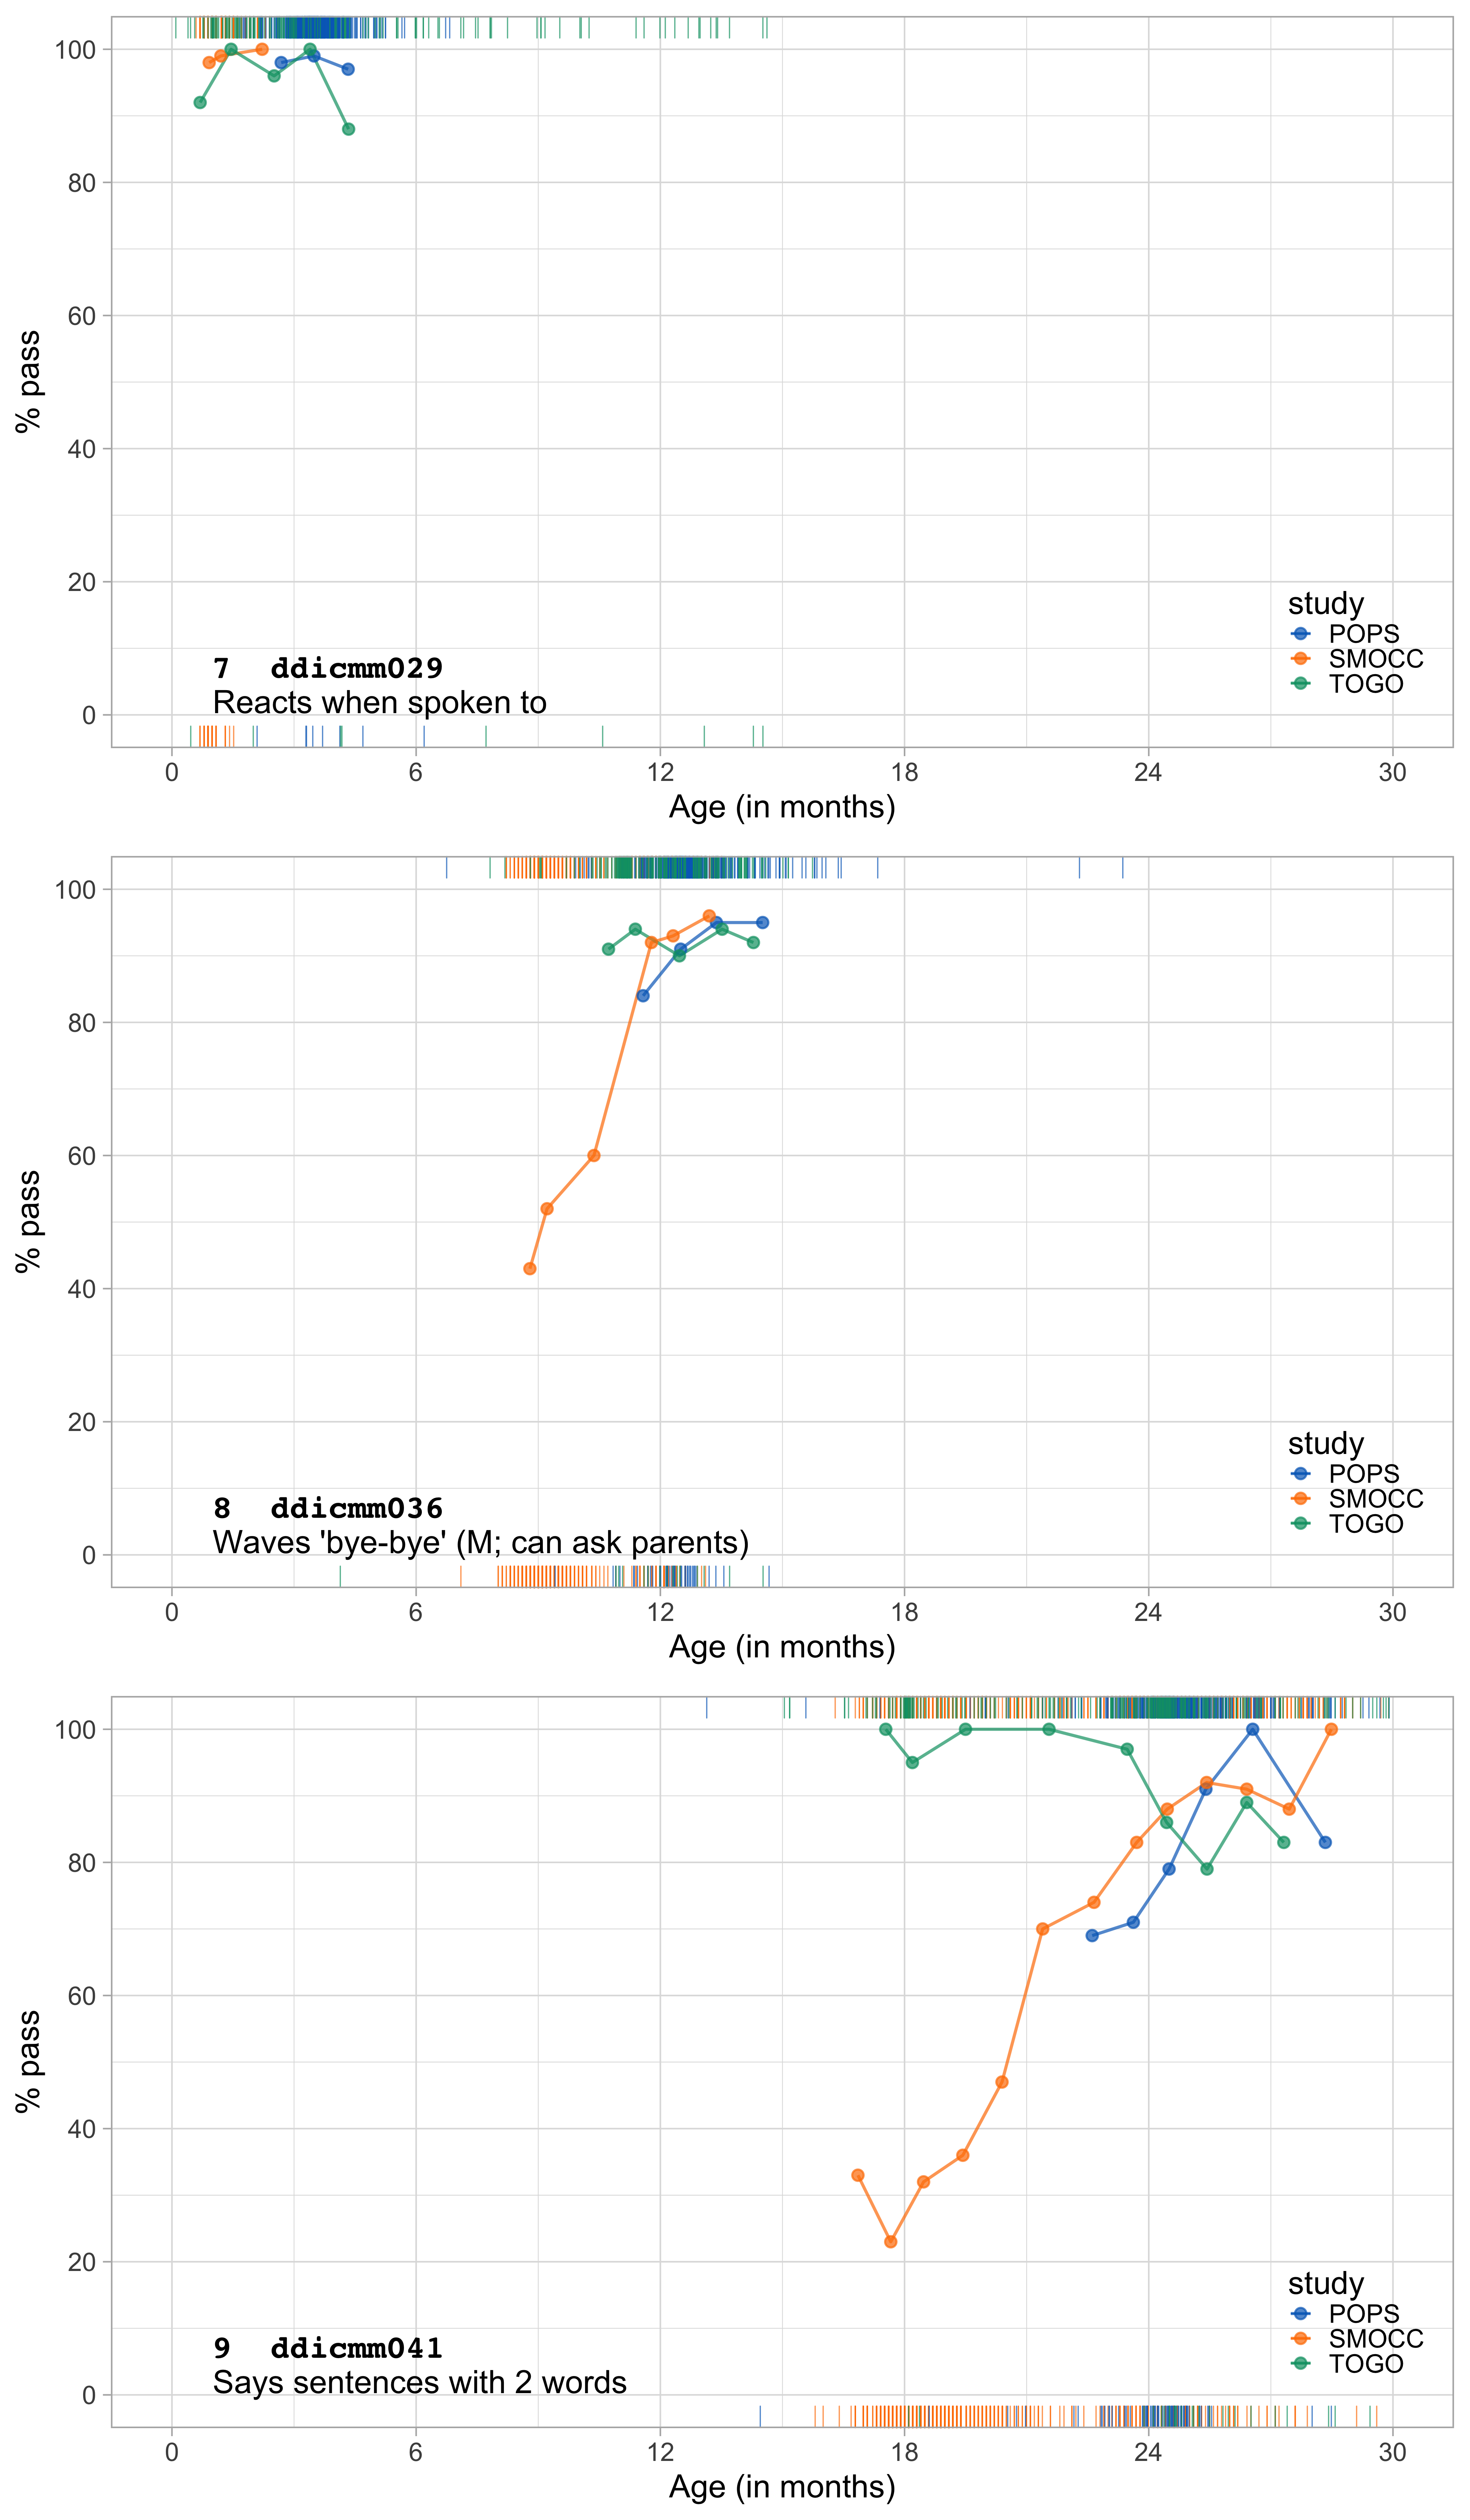
Figure 9.14: Communication and language milestones. Probability by age for SMOCC, POPS (corrected age) and TOGO studies for three milestones.
Figure 9.14 summarizes the data for three milestones on communication and language. In general, the success probability is similar in the three studies.
One curious finding is that the high proportion of milestones passes in ddicmm041 for the Togo children around the age of 18 months. Note that several of the green lines in Figures 9.12-9.14 start close to perfect scores, which makes it impossible to show the rising patterns found in the Dutch data.
It may indeed be true that children from Togo develop more rapidly than Dutch children. But we may also wonder: Could there just be reporting bias on the part of the parents who either do not understand the items or have the expectation to say “yes” even if the child can’t do it? It would be desirable if these results could be backed up from other sources.