2.3 Example of motor development
2.3.1 Shirley’s motor data
For illustration, we use data on loco-motor development from a classic study on child development among 25 babies. Shirley (1931) collected measurements of the baby’s walking ability, starting at ages around 13 weeks, in an ingenious way. The investigator lays out a white paper of twelve inches wide on the floor of the living room, and lightly greases the soles of the baby’s feet with olive oil. The baby was invited to “walk” on the sheet. Of course, very young infants need substantial assistance. Footprints left were later coloured by graphite and measured. Measurements during the first year were repeated every week or bi-weekly.
Name | Sex | Stepping | Standing | Walking with help | Walking alone |
Martin | boy | 15 | 21 | 50 | |
Carol | girl | 15 | 19 | 37 | 50 |
Max | boy | 14 | 25 | 54 | |
Virginia Ruth | girl | 21 | 41 | 54 | |
Sibyl | girl | 22 | 37 | 58 | |
David | boy | 19 | 27 | 34 | 60 |
James D. | boy | 19 | 30 | 45 | 60 |
Harvey | boy | 14 | 27 | 42 | 62 |
Winnifred | girl | 15 | 30 | 41 | 62 |
Quentin | boy | 15 | 23 | 38 | 64 |
Maurice | boy | 18 | 23 | 45 | 66 |
Judy | girl | 18 | 29 | 45 | 66 |
Irene May | girl | 19 | 34 | 45 | 66 |
Peter | boy | 15 | 29 | 49 | 66 |
Walley | boy | 18 | 33 | 54 | 68 |
Fred | boy | 15 | 32 | 46 | 70 |
Donovan | boy | 23 | 50 | 70 | |
Patricia | girl | 15 | 30 | 45 | 70 |
Torey | boy | 21 | 72 | 74 | |
Larry | boy | 13 | 41 | 54 | 76 |
Doris | girl | 23 | 44 |
Table 2.1 (Shirley 1931, Appendix 8) lists the age (in weeks) of the 21 babies when they started, respectively, stepping, standing, walking with help, and walking alone. Blanks indicate missing data. A blank in the first column means that the baby was already stepping when the observation started (Virginia Ruth, Sibyl, Donovan, Torey and Doris). Max and Martin, who have blanks in the second column, skipped standing and went directly from stepping to walking with help. Doris has a blank in the last column because she passed away before she could walk alone.
2.3.2 Individual trajectories of motor development
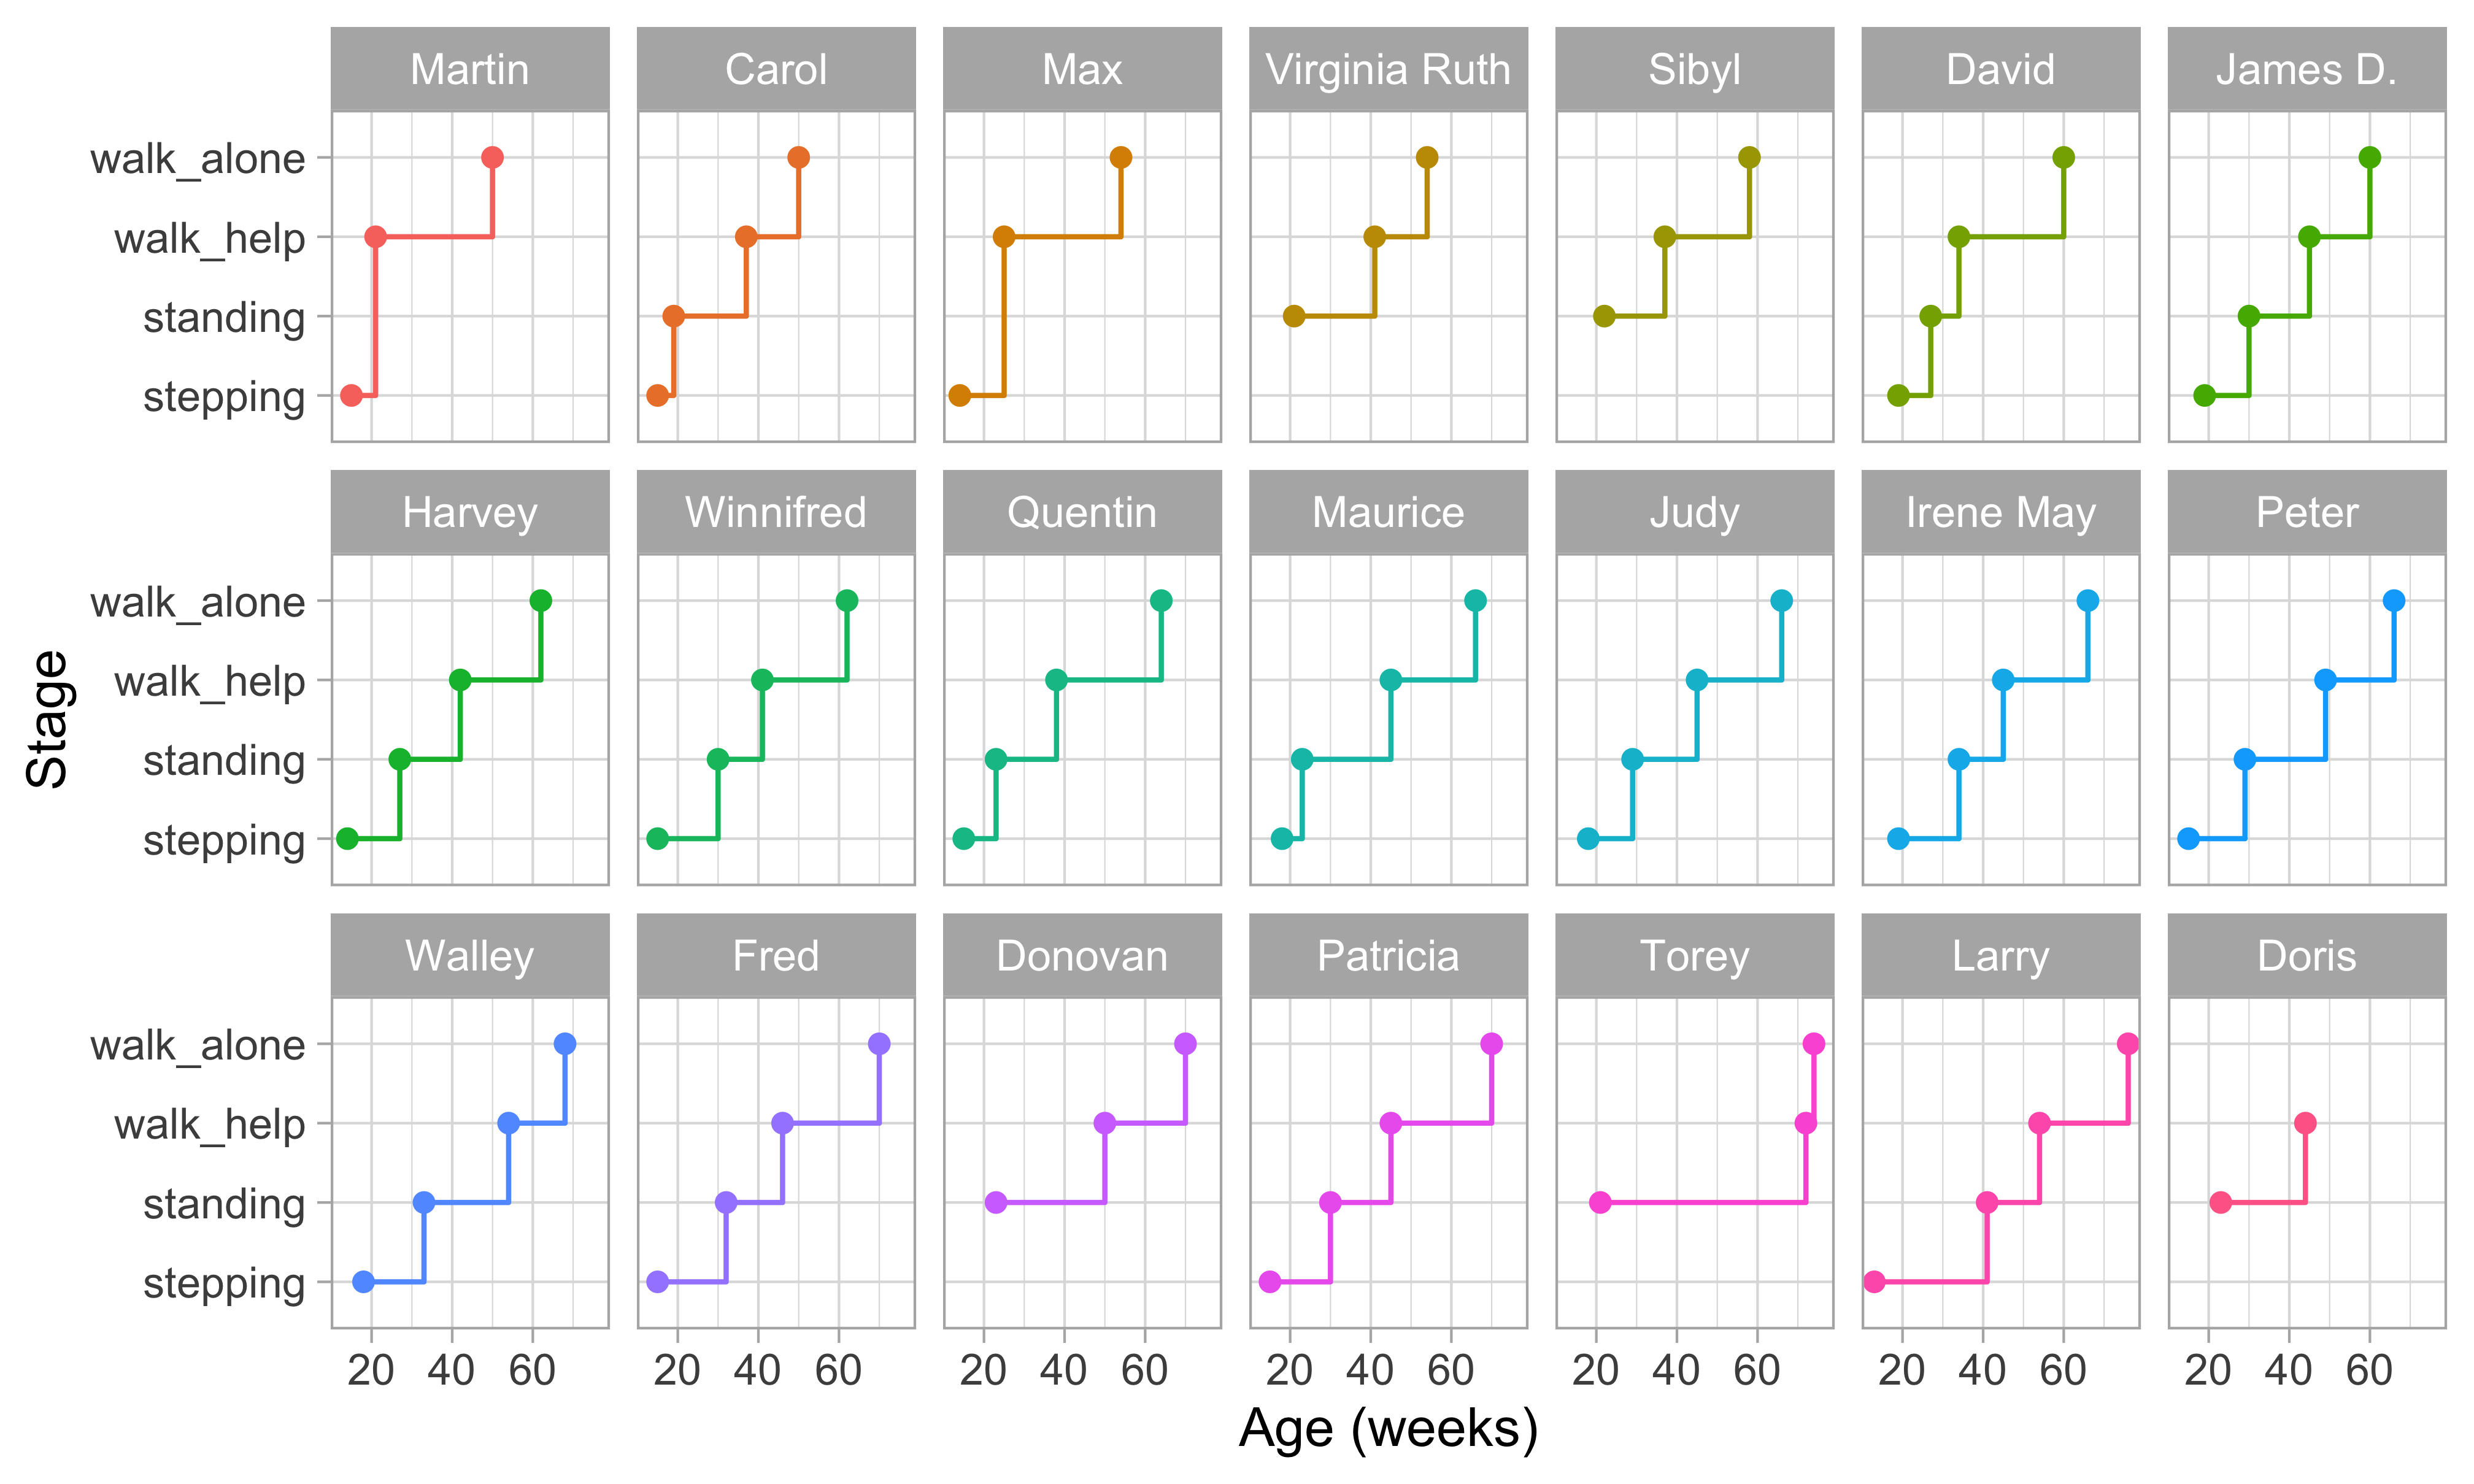
Figure 2.3: Staircase plot indicating the age at which each baby achieves a new milestone of gross-motor functioning.
Figure 2.3 is a visual representation of the information in Table 2.1. Each data point is the age of the first occurrence of the next stage. Before that age, we assume the baby is in the previous stage.
Figure 2.3 makes it easy to spot the quick walkers (Martin, Carol) and slow walkers (Patricia, Torey, Larry). Furthermore, we may also locate children who remain a long time in a particular stage (Torey, Larry) or who jump over stages (Martin, Max).
For ease of plotting, the categories on the vertical axis are equally spaced. The height of the jump from one stage to the next has no sensible interpretation. We might be inclined to think that the vertical distance portrays to how difficult it is to achieve the next stage, but this is inaccurate. Instead, the ability needed to set the next step corresponds to the horizontal line length between stages. For example, on average, the line for stepping is rather short in all plots, so going from stepping to standing is relatively easy.
Figure 2.3 presents data from only those visits where a jump occurred. The number of house visits made during the ages of 0-2 years was far higher. Shirley (1931) collected data from 1370 visits, whereas Figure 2.3 plot only the 76 occasions that showed a jump. Thus the data collection needs to be intense and costly to obtain individual curves. Fortunately, there are alternatives that are much more efficient.