9.1 SMOCC study
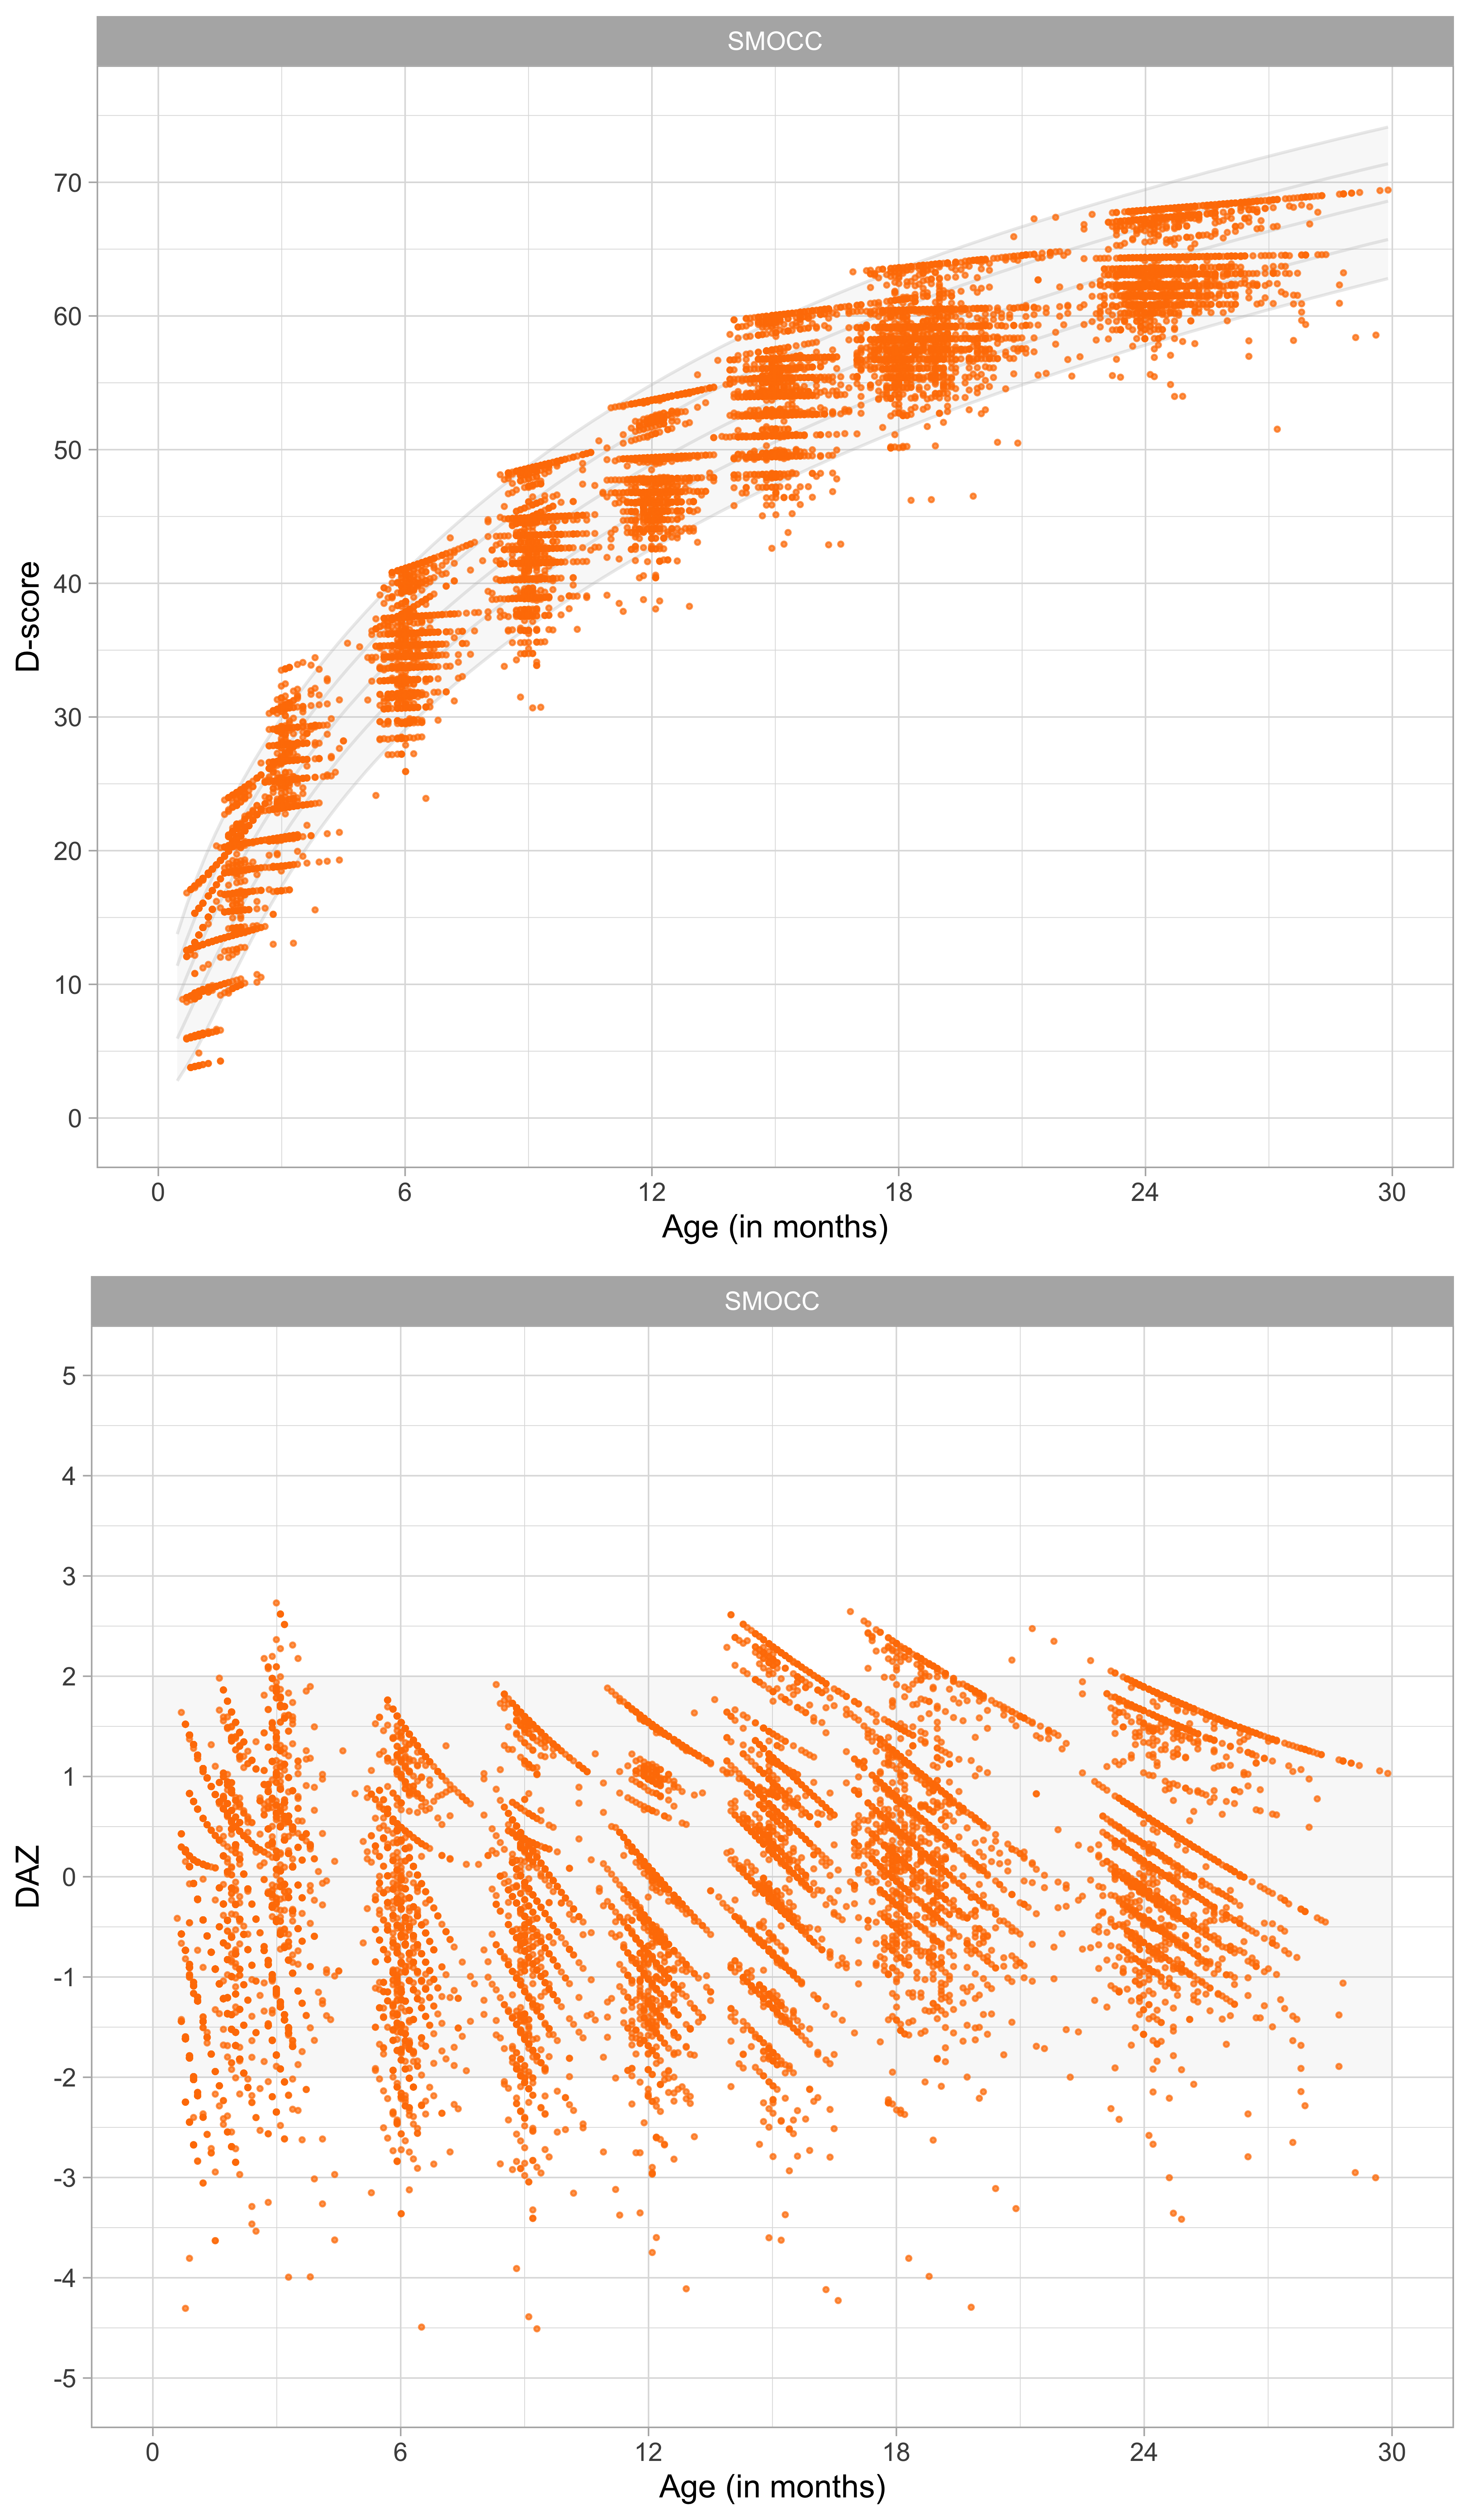
Figure 9.1: Distribution of D-score and DAZ by child age in a cohort of Dutch children aged 0-2 years (Source: SMOCC data, \(n\) = 2151, 9 occasions).
Figure 9.1 shows the D-score distribution by age in the SMOCC data. The grey curves represent references calculated from the SMOCC data. The top figure illustrates that rise of the D-score with age, whereas the bottom chart shows that the DAZ distribution covers the references well.
The ceiling effect causes low coverage after the age of 24 months. There are also less prominent ceiling effects for younger children. Without these effects, the references would presumably show some additional variation.