3.2 Probability-based measurement
An alternative is to calculate the probability of achieving a milestone at a given age and compare the child’s response to that probability.
The passing probability is an interpretable and relevant measure. An operational advantage of the approach is that the necessary calculations place fewer demands on the available data and can be done even for cross-sectional studies.
3.2.1 Example of probability-based measurement
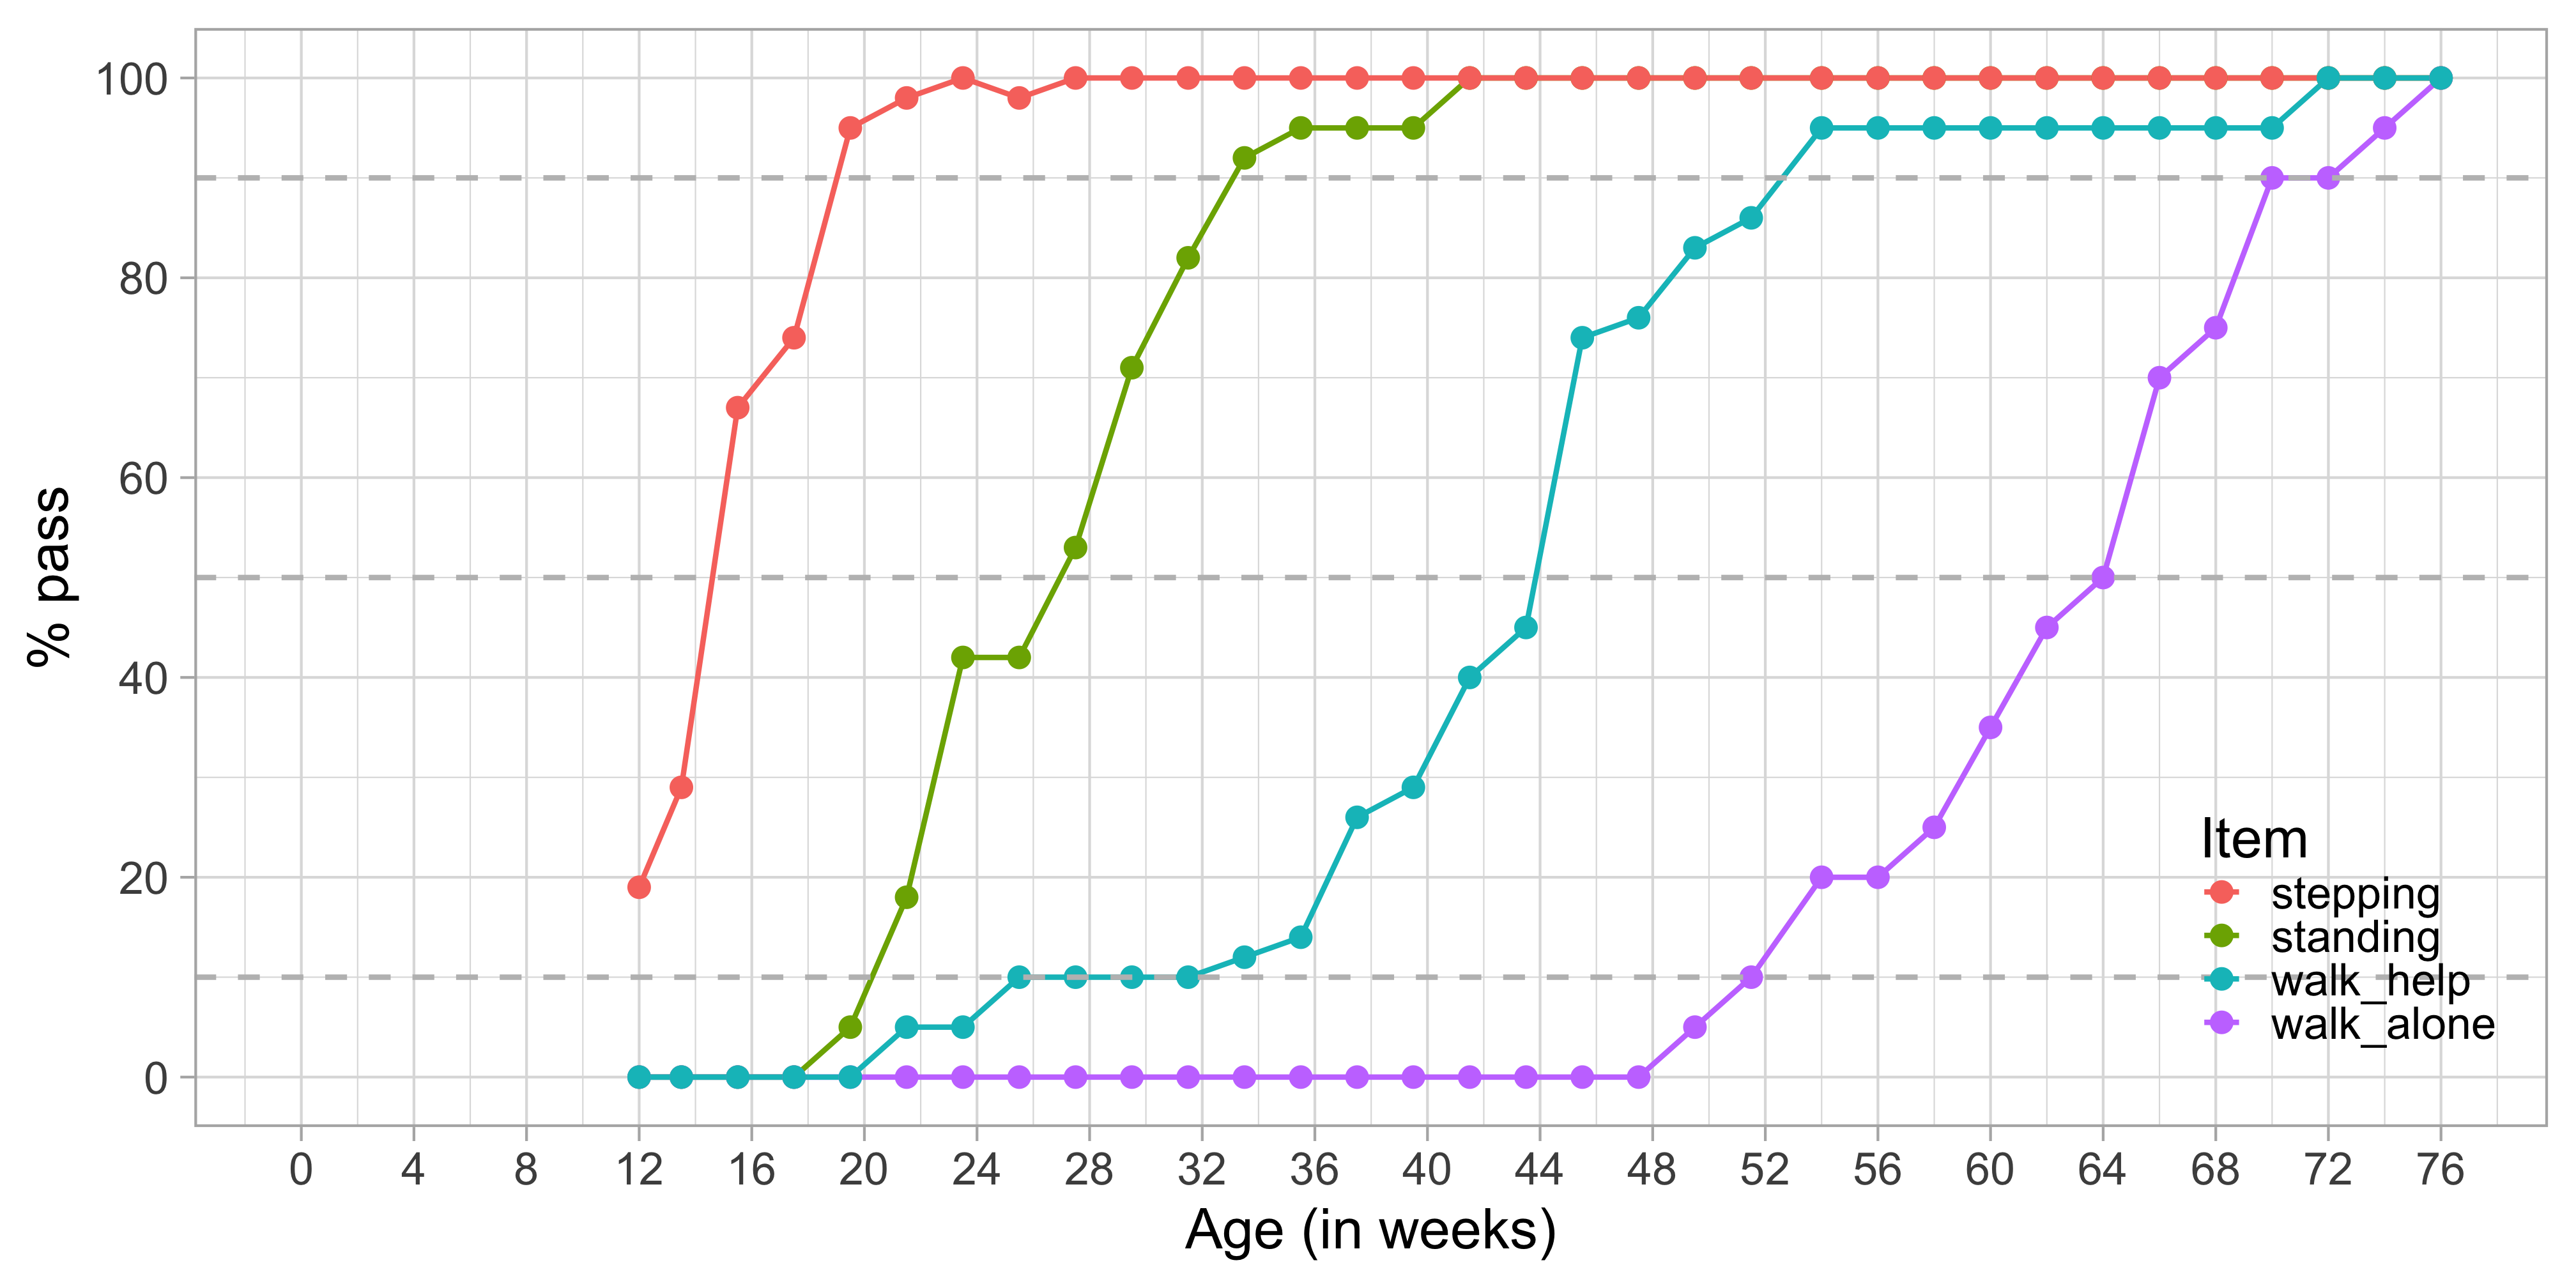
Figure 3.3: Probability of achieving four motor milestones against age.
Figure 3.3 plots the percentage of children achieving each of Shirley’s motor stages against age. There are four cumulative curves, one for each milestone, that indicate the percentage of children that pass.
In analogy to the age equivalent introduced in Section 3.1.2 we can define the difficulty of the milestone as the age at which 50 per cent of the children pass. In the Figure we see that the levels of difficulty are approximately 14.2 weeks (stepping), 27.0 weeks (standing), 43.8 weeks (walking with help) and 64.0 weeks (walking alone). Also, we may easily find the ages at which 10 per cent or 90 per cent of the children pass each milestone.
Observe there is a gradual decline in the steepness as we move from stepping to walk_alone. For example, we need an age interval of 13 weeks (33 - 20) to go from 10 to 90 per cent in standing, but need 19 weeks (71 - 52) to go from 10 to 90 per cent in walking alone. Thus, one step on the age axis corresponds to different increments in probability. The flattening pattern is typical for child development and represents evidence that evolution is faster at earlier ages.
3.2.2 Limitations of probability-based measurement
Probability-based measurement is a popular way to create instruments for screening on developmental delay. For example, each milestone in the Denver II (Frankenburg et al. 1992) has markers for the 25th, 50th, 75th and 90th age percentile.
- The same age step corresponds to different probabilities.
- The measurement cannot exist without some norm population. When norms differ, we cannot compare the measurements.
- Interpretation is at the milestone level, sometimes supplemented by procedures for counting the number of delays. No aggregate takes all responses into account.