8.3 Impact of short tests on predicting IQ
8.3.1 Measurement and prediction
In Section 8.2, we saw that a short test can measure the middle or one tail of the distribution, but cannot be precise for both at the same time. If we want to identify children at risk for delayed development, we are interested in the lower tail of the distribution, so in that case, the standard set is suitable. But what set should we use if we want to predict a later outcome?
This section explores that effect of taking different milestone sets on the quality of prediction.
8.3.2 UKKI
Hafkamp-de Groen et al. (2009) studied the effect of the D-score on later intelligence, using a subset of 557 SMOCC children that were followed up at the age of five years.
The Utrechtse Korte Kleuter Intelligentietest (UKKI) (Baarda 1978) is a short test to measure intelligence. The UKKI is a simple test with just three components:
- Redraw five figures (square, triangle, cross, trapezoid, rhomboid);
- Draw human figure, with 28 characteristics, like legs, eyes, and so on;
- Give meaning to 13 words like knife, banana, umbrella, and so on.
Administration time is about 15-20 minutes. The UKKI has a reasonable test-retest reliability for group use (Pearson \(r = 0.74\), 3-month interval).
8.3.3 Exploratory analysis
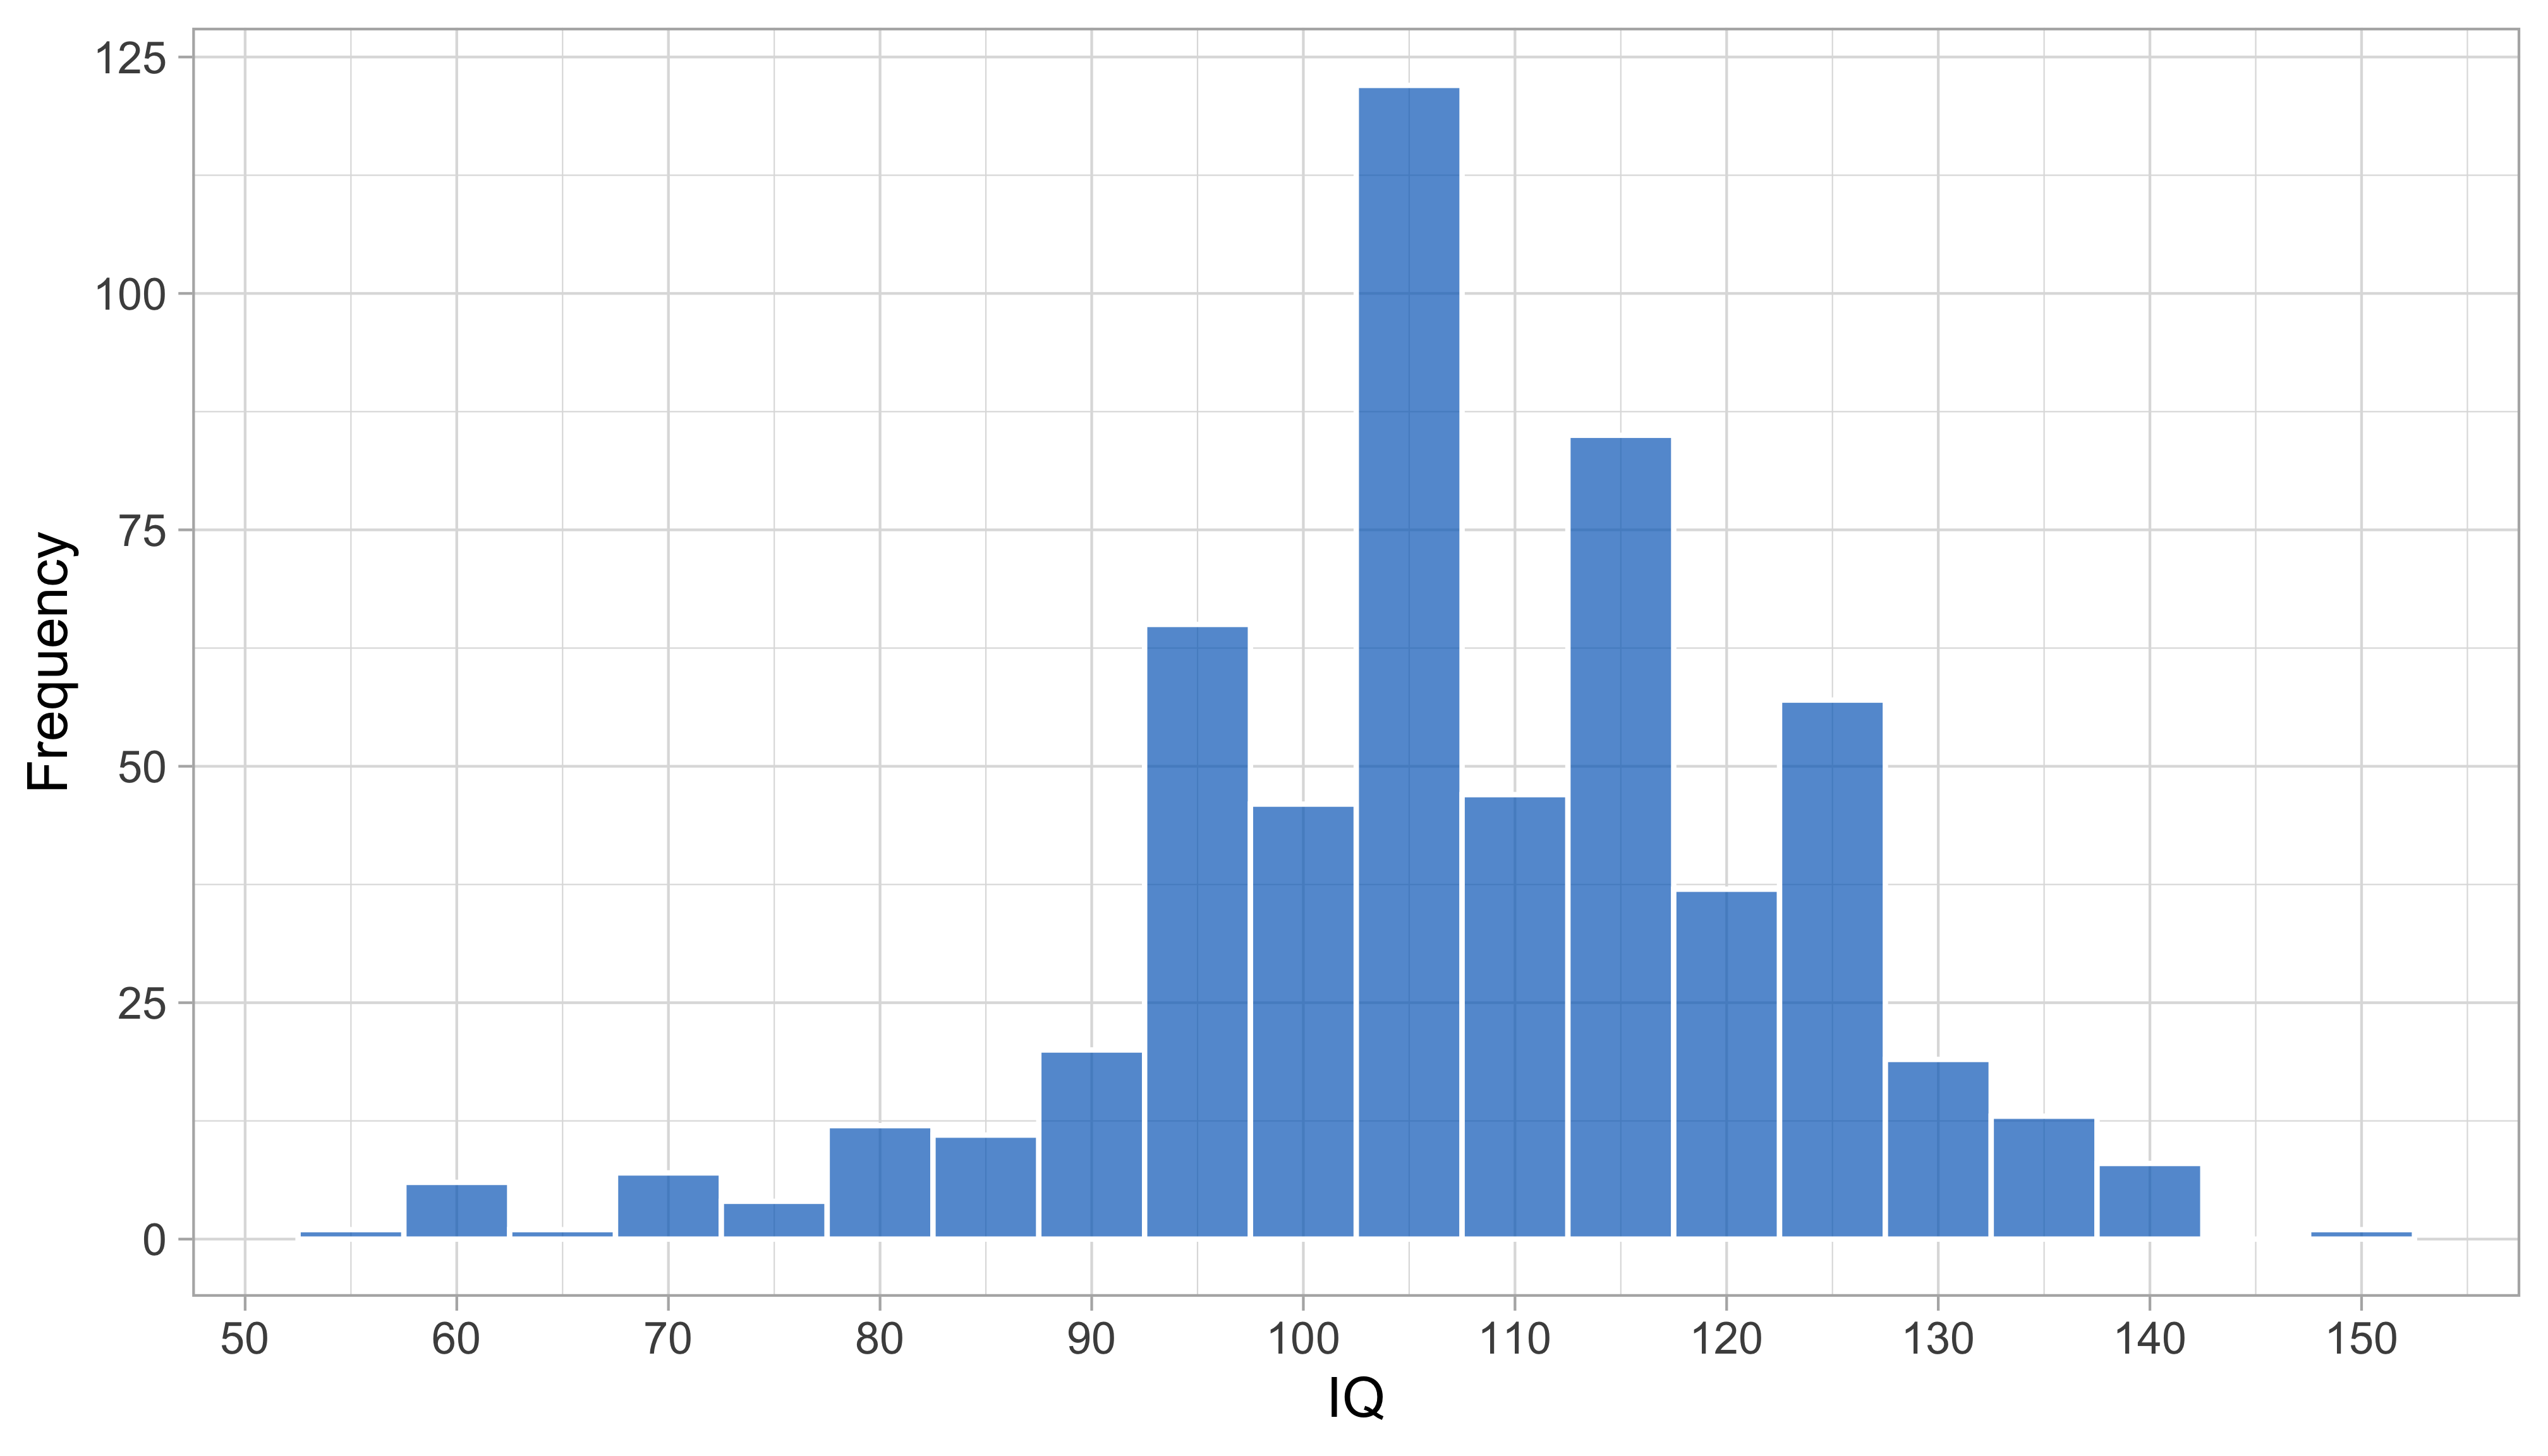
Figure 8.5: Histogram of UKKI IQ scores taken around the age of five years (SMOCC data, \(n = 557\)).
Figure 8.5 shows the empirical IQ distribution of 557 children. The mean IQ score is 108, and the standard deviation is 15, so the IQ-scores of children in the sample is about a half standard deviation above the 1978 reference sample.
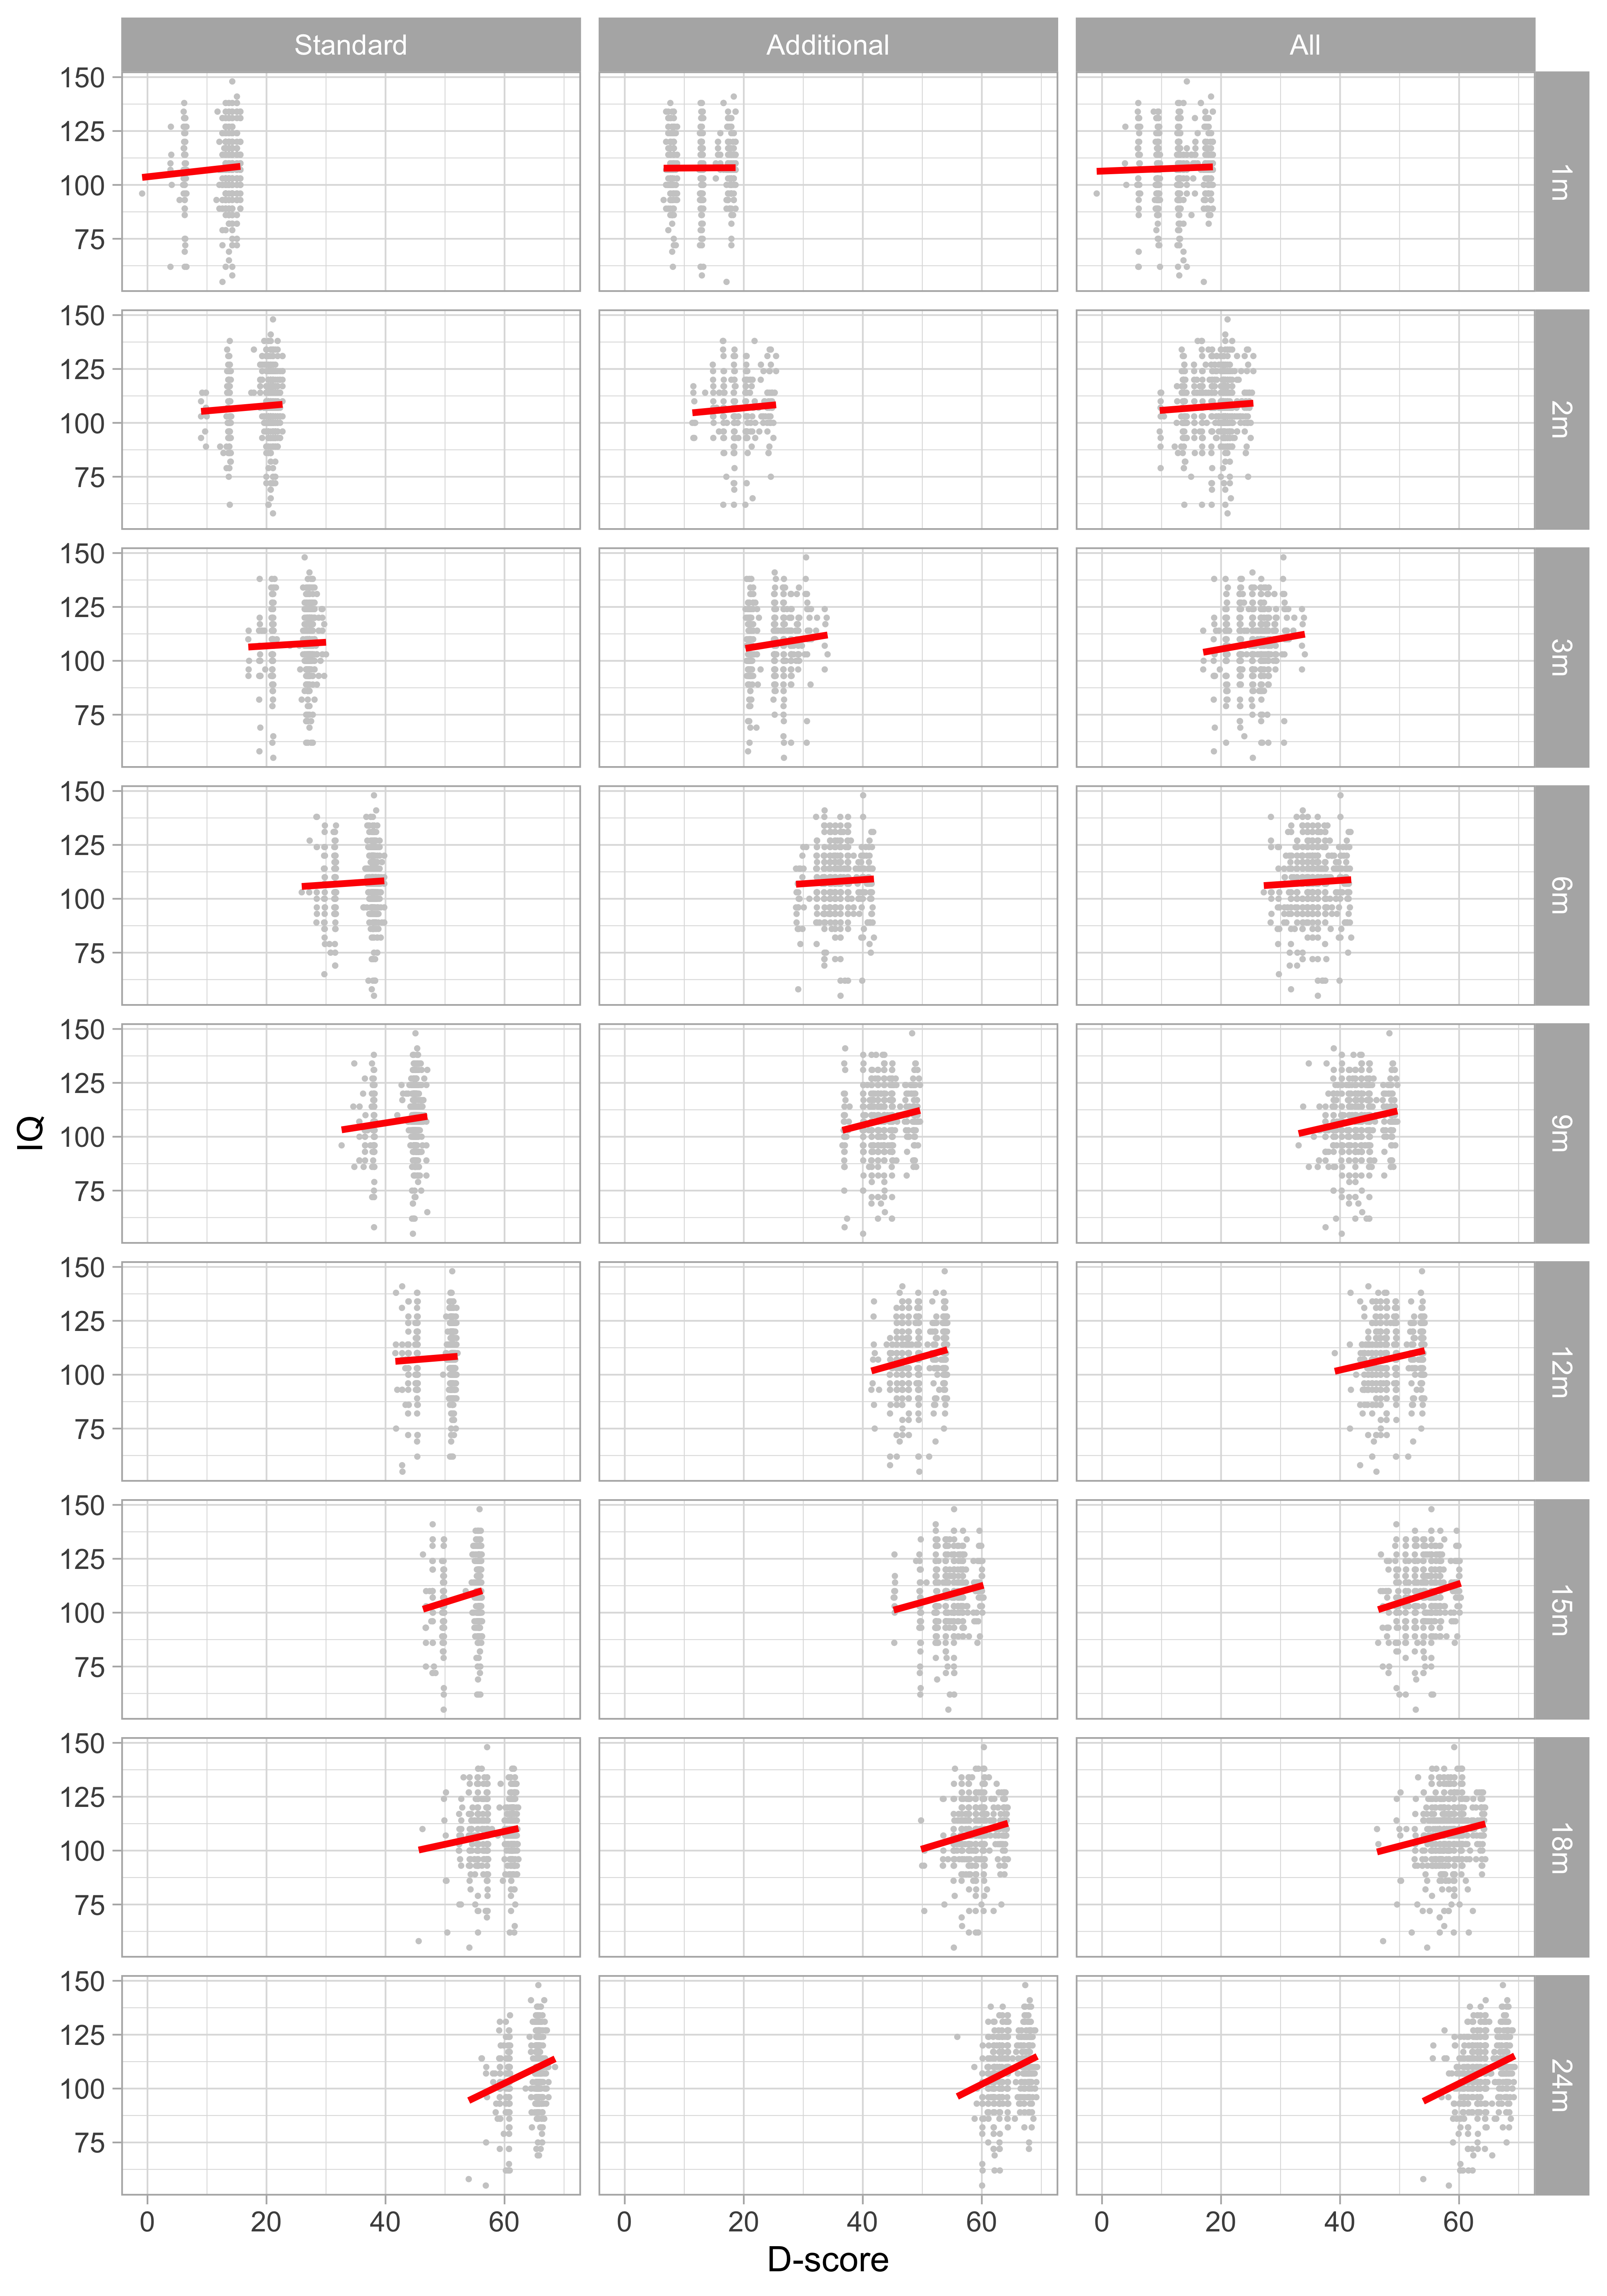
Figure 8.6: Relation between D-score at infancy and IQ at age 5 years according to three milestone sets and nine visits (SMOCC data, \(n = 557\)).
Figure 8.6 shows that the relation between the D-score 0-2 years and IQ at five years is positive for all milestone sets and all ages. The strength of the association increases with age. At the age of 2 years, the regression coefficient for D-score is equal to \(\beta(D) = 1.4\) (SE: \(0.21, p < 0.0001\)), so on average an increase of 1.0 unit in the D-score at the age of 2 years corresponds to a 1.4 IQ-score points increase at the age five years.
Visit | Standard set | Additional set | All milestones |
1m | 0.059 | 0.005 | 0.027 |
2m | 0.051 | 0.056 | 0.048 |
3m | 0.036 | 0.100 | 0.102 |
6m | 0.040 | 0.038 | 0.036 |
9m | 0.094 | 0.143 | 0.132 |
12m | 0.046 | 0.162 | 0.137 |
15m | 0.180 | 0.153 | 0.187 |
18m | 0.129 | 0.153 | 0.146 |
24m | 0.245 | 0.255 | 0.267 |
Table 8.2 summarizes the Pearson correlations between the D-score and later IQ. The association between D-score and IQ is weak during the first year of life but gets stronger during the second year. In general, having more (and more informative) milestones helps to increase the correlation, but the effects are relatively small. So even from the standard set of the seven easy milestones at 24m, we obtain a reasonable correlation of 0.245.
All in all, these results suggest that neither the amount nor the difficulty level of the milestones is critical in determining the strength of the relation between the D-score and IQ.