4.4 Relation between age and the D-score
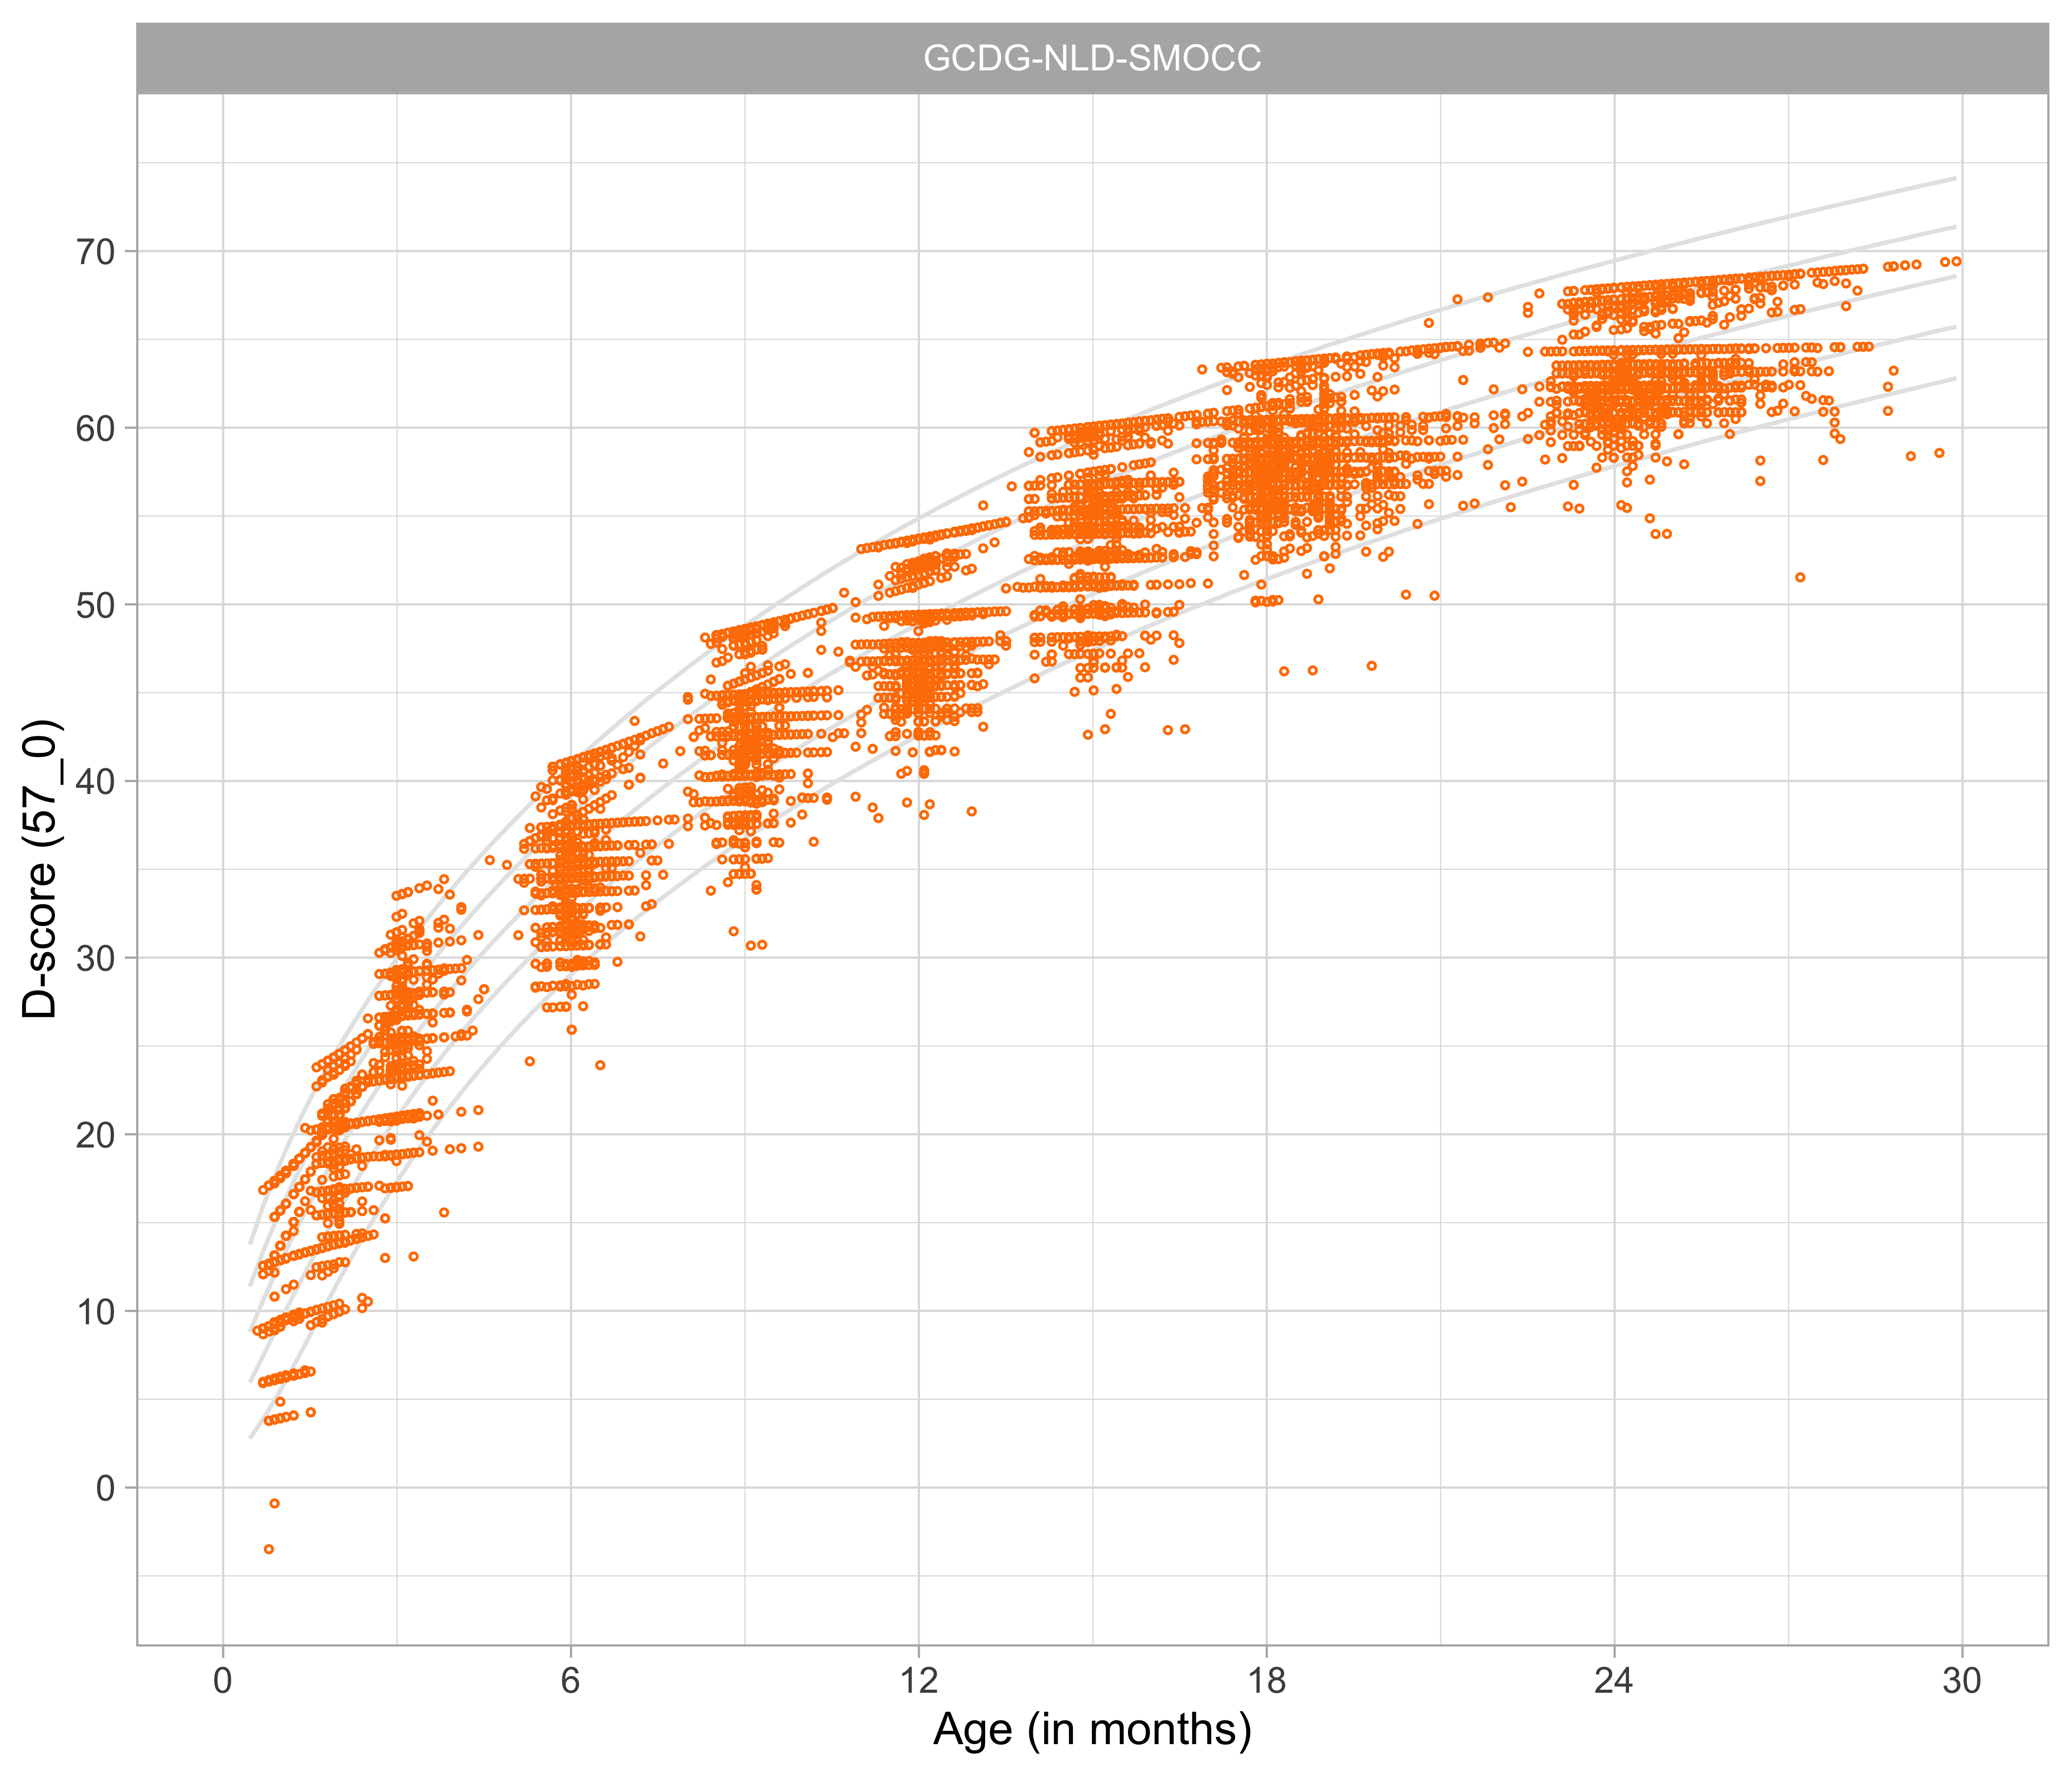
Figure 4.3: Relation between child D-score and child age in a cohort of Dutch children (Source: SMOCC data, \(n\) = 2151, 9 occasions).
Figure 4.3 shows that the relation between D-score and age is nonlinear. Development in the first year is more rapid than in the second year. During the first year, infants gain about 40\(D\), whereas in the second year they gain about 20\(D\). A similar change in growth rate occurs in length (first year: 23 cm, second year: 12 cm, for Dutch children).
Figure 4.4: 3D-line graph illustrating how the patterns in Figures 4.1 and 4.2 induce the curvature in the relation between D-score and age. The printed version shows three orientations of the relation between age, percent pass and D-score. The online version holds an interactive 3D graph that the reader can actively manipulate the orientation of the graph by click-hold-drag mouse operations.
Figure 4.4 shows the mutual relations between age, percentage of milestone passing and the D-score. There are three main orientations.
- In the default orientation (age on the horizontal axis, D-score on the vertical axis), we see a curvilinear relation between the age and item difficulty.
- Rotate the graph (age on the horizontal axis, passing percentage on the vertical axis). Observe that this is the same pattern as in Figure 4.1 (with unequal slopes). Curves are coloured by domain.
- Rotate the graph (D-score on the horizontal axis, passing percentage on the vertical axis). Observe that this pattern is the same as in Figure 4.2 (with equal slopes).
All patterns can co-exist because of the curvature in the relation between D-score and age. The curvature is never explicitly modelled or defined, but a consequence of the equal-slopes assumption in the relation between the D-score and the passing percentage of a milestone.