8.2 D-score from short tests
8.2.1 Milestone sets
In the analyses done thus far, we have calculated D-scores from responses on the combined (standard plus additional) milestones. Thus, at the 2-month visit, the D-score was calculated from 2 (standard) + 5 (additional) = 7 milestones.
In daily practice, the set of additional milestones is often lacking. This section explores the impact of using the (smaller) subset of standard milestones on measurement error and prediction.
This section reports and compares three D-scores:
- D-score from standard milestones;
- D-score from additional milestones.
- D-score from all available milestones;
Estimation of 1 is more complicated than for 2 and 3, for the following reasons:
- There are fewer milestones, so the estimate is less precise and more influenced by choice of the prior distribution;
- The standard set contains only easy milestones, which are uninformative for the majority of children.
8.2.2 Milestone sets at month 2
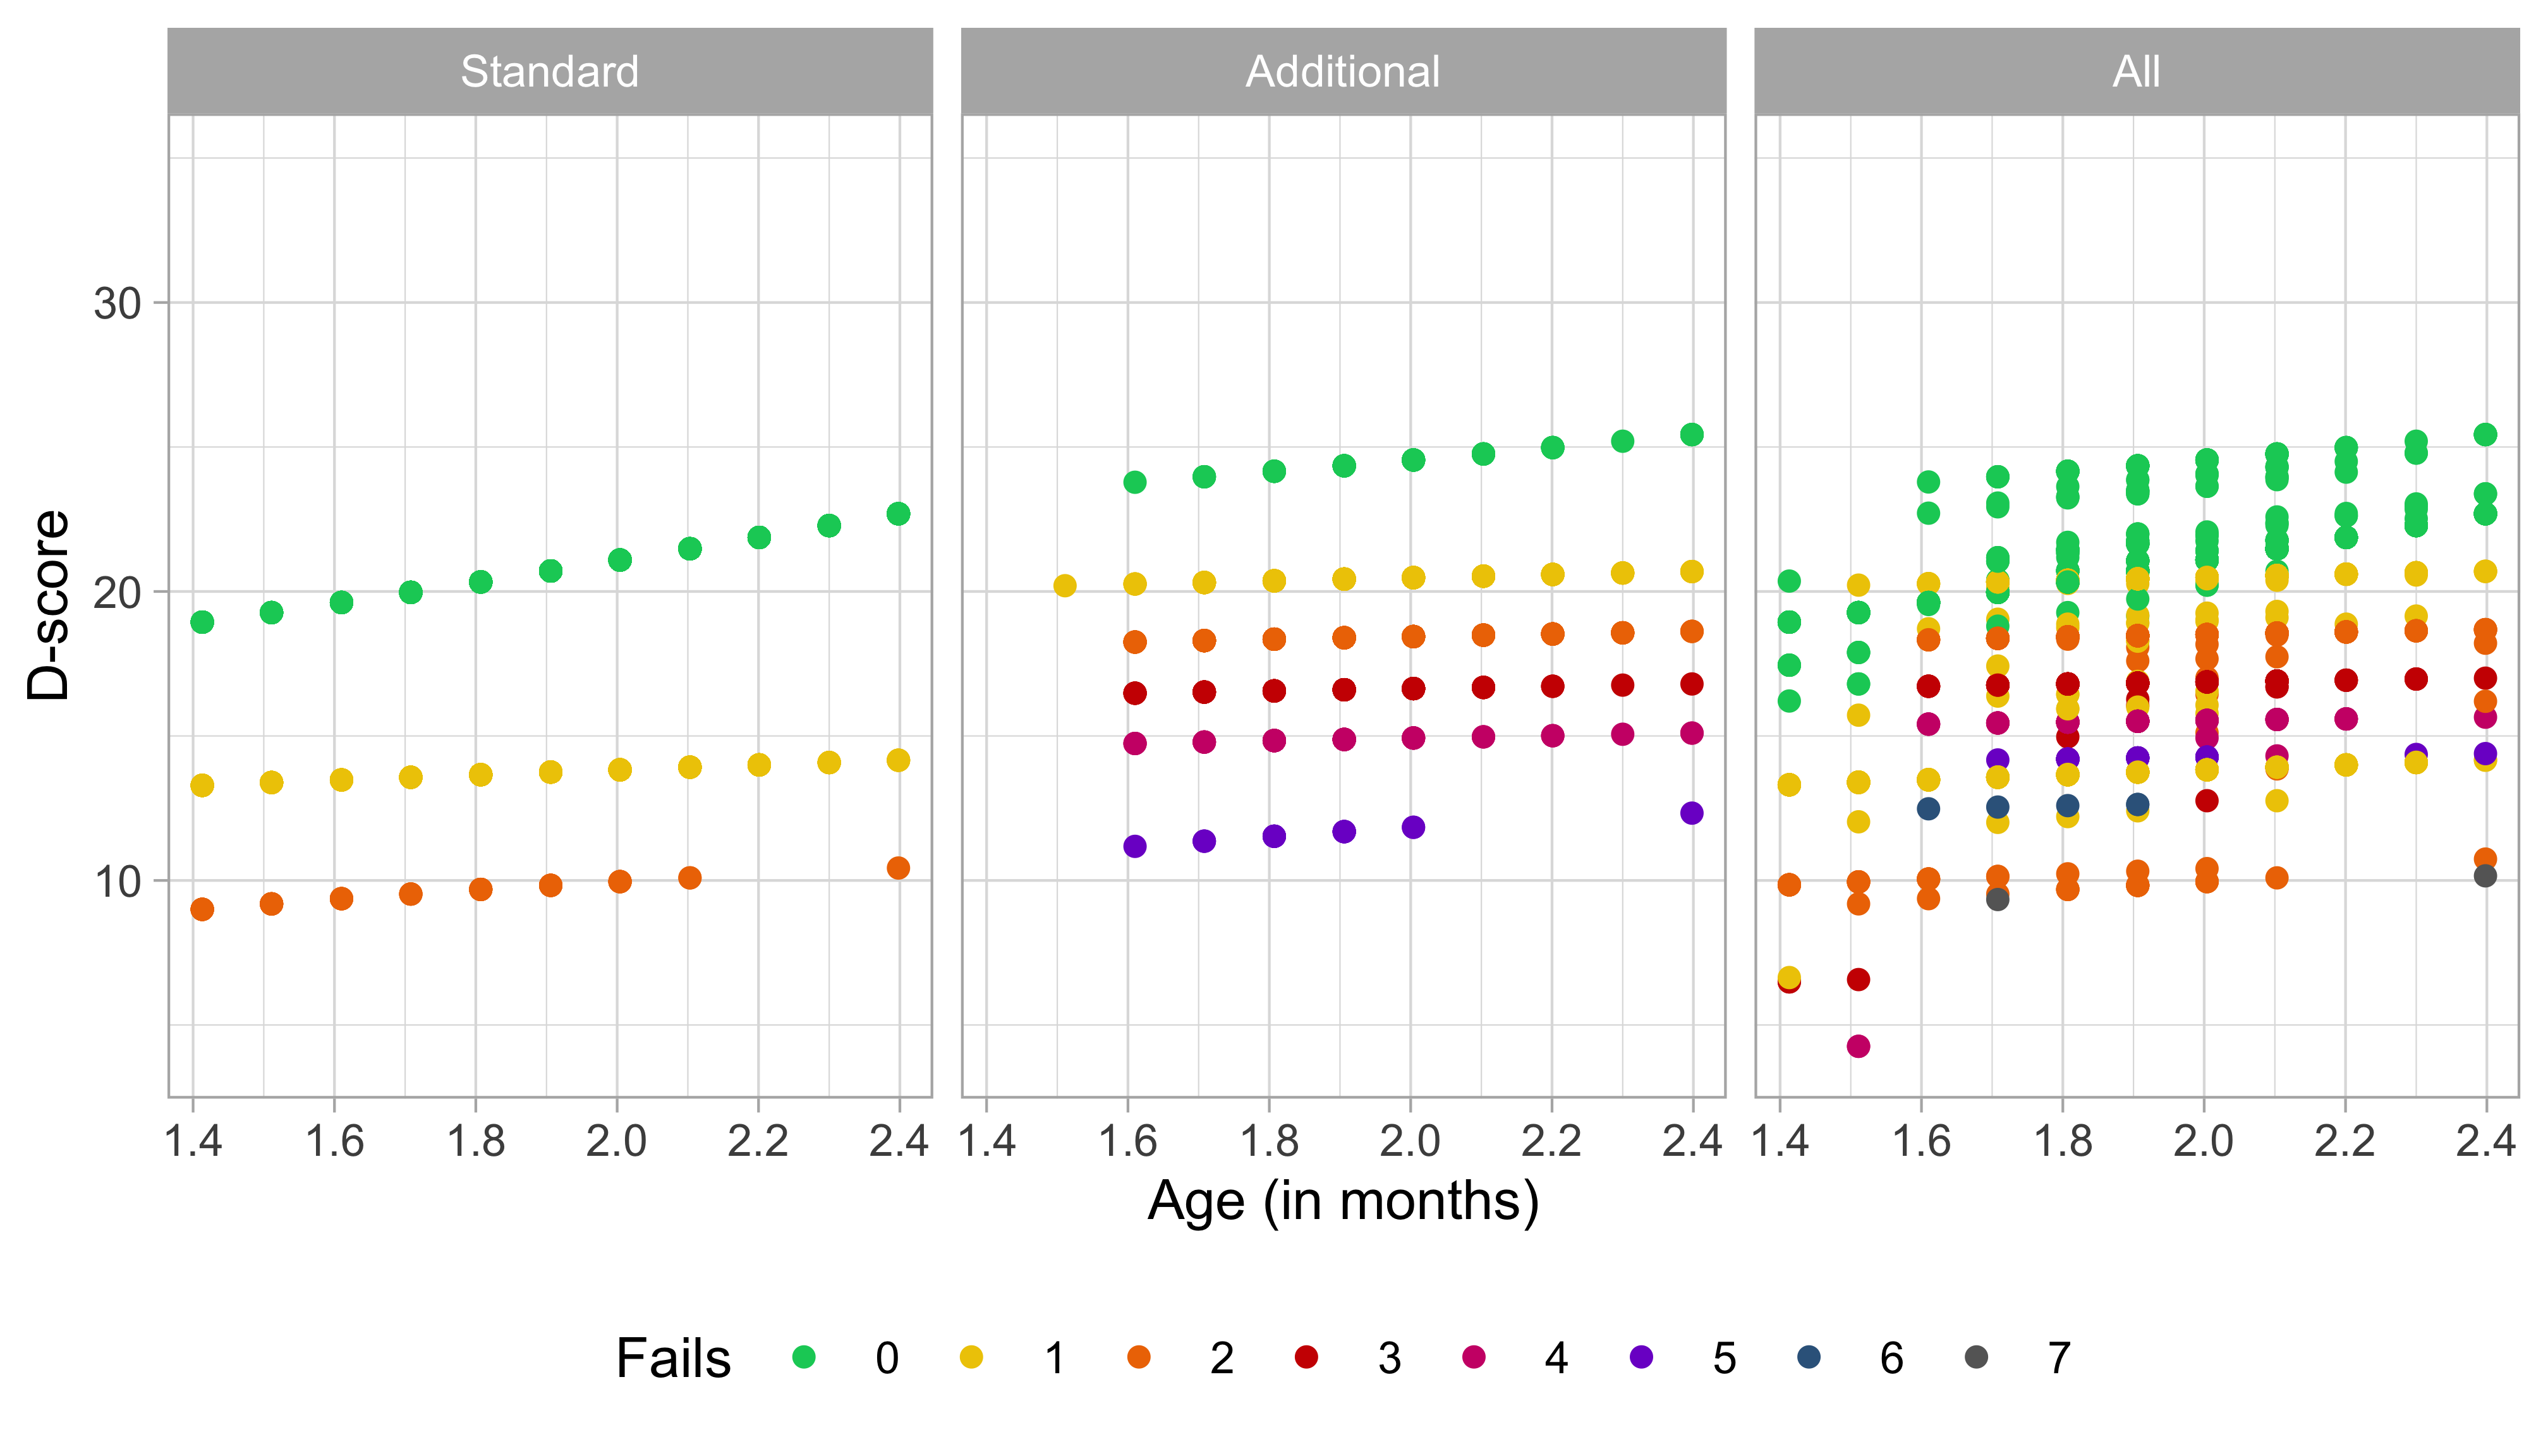
Figure 8.2: Distribution of the D-scores calculated from the standard, additional and all available milestones at month 2. Colors correspond to the number of fails.
The vertical axis of Figure 8.2 shows the D-score, separately calculated from the standard, additional and all milestones for children aged two months. The colour of the dots represents the number of FAIL ratings within each set of milestones.
At month two there are just two standard milestones: ddicmm030 and ddifmd002. About 90 per cent of the infants will pass these. The green dots in the left-hand side figure represent the estimated D-scores corresponding to two passes. As explained in Section 5.3.2, we calculate the D-score with an age-dependent prior. If the ages vary (and they do), then the D-score for infants having the same total score will also vary.
If a child fails either ddicmm030 or ddifmd002, then the D-score is substantially lower. The left-hand figure shows a gap between the green dots (perfect score) and the yellow dots (one FAIL). The impact of a FAIL on the D-score is substantial. For example, the D-score of an infant with one FAIL on a standard milestone drops from about 20\(D\) to 14\(D\). Thus, with these two milestones, there cannot be a D-score in the range 15\(D\) - 18\(D\). It depends on the purposes of the measurement if this is acceptable. We can prevent gaps by measuring more milestones, e.g., milestones taken from the additional set. Another gap occurs between 14\(D\) and 11\(D\). These gaps illustrate that precision is constrained if we administer only two milestones.
The middle figure shows the estimated D-score at the same visit but now calculated from the five additional milestones (i.e., the standard milestones from month 3). Infant aged two months have approximately a 50 per cent chance of passing each. Note that administration of the additional milestones will cover the range 14D-20\(D\) quite well. Note the ceiling is also higher with these milestones.
Note that the range of the estimated D-scores is quite similar in both plots. This similarity is a result of accounting for the difficulty level of milestones. The estimate of the D-score is unbiased for difficulty.
The figure on the right-hand side provides the D-score calculated from all milestones. We can easily recognise the points coming from the standard and additional sets. Also, there is a limited number of ratings on easier items that belong to month 1. We rescored these because the child failed these milestones at the previous visit. Rescoring effectively extends the range of possible D-scores to the lower end, so now we can find some children who have D-score lower than 10\(D\).
8.2.3 Milestone sets at month 3
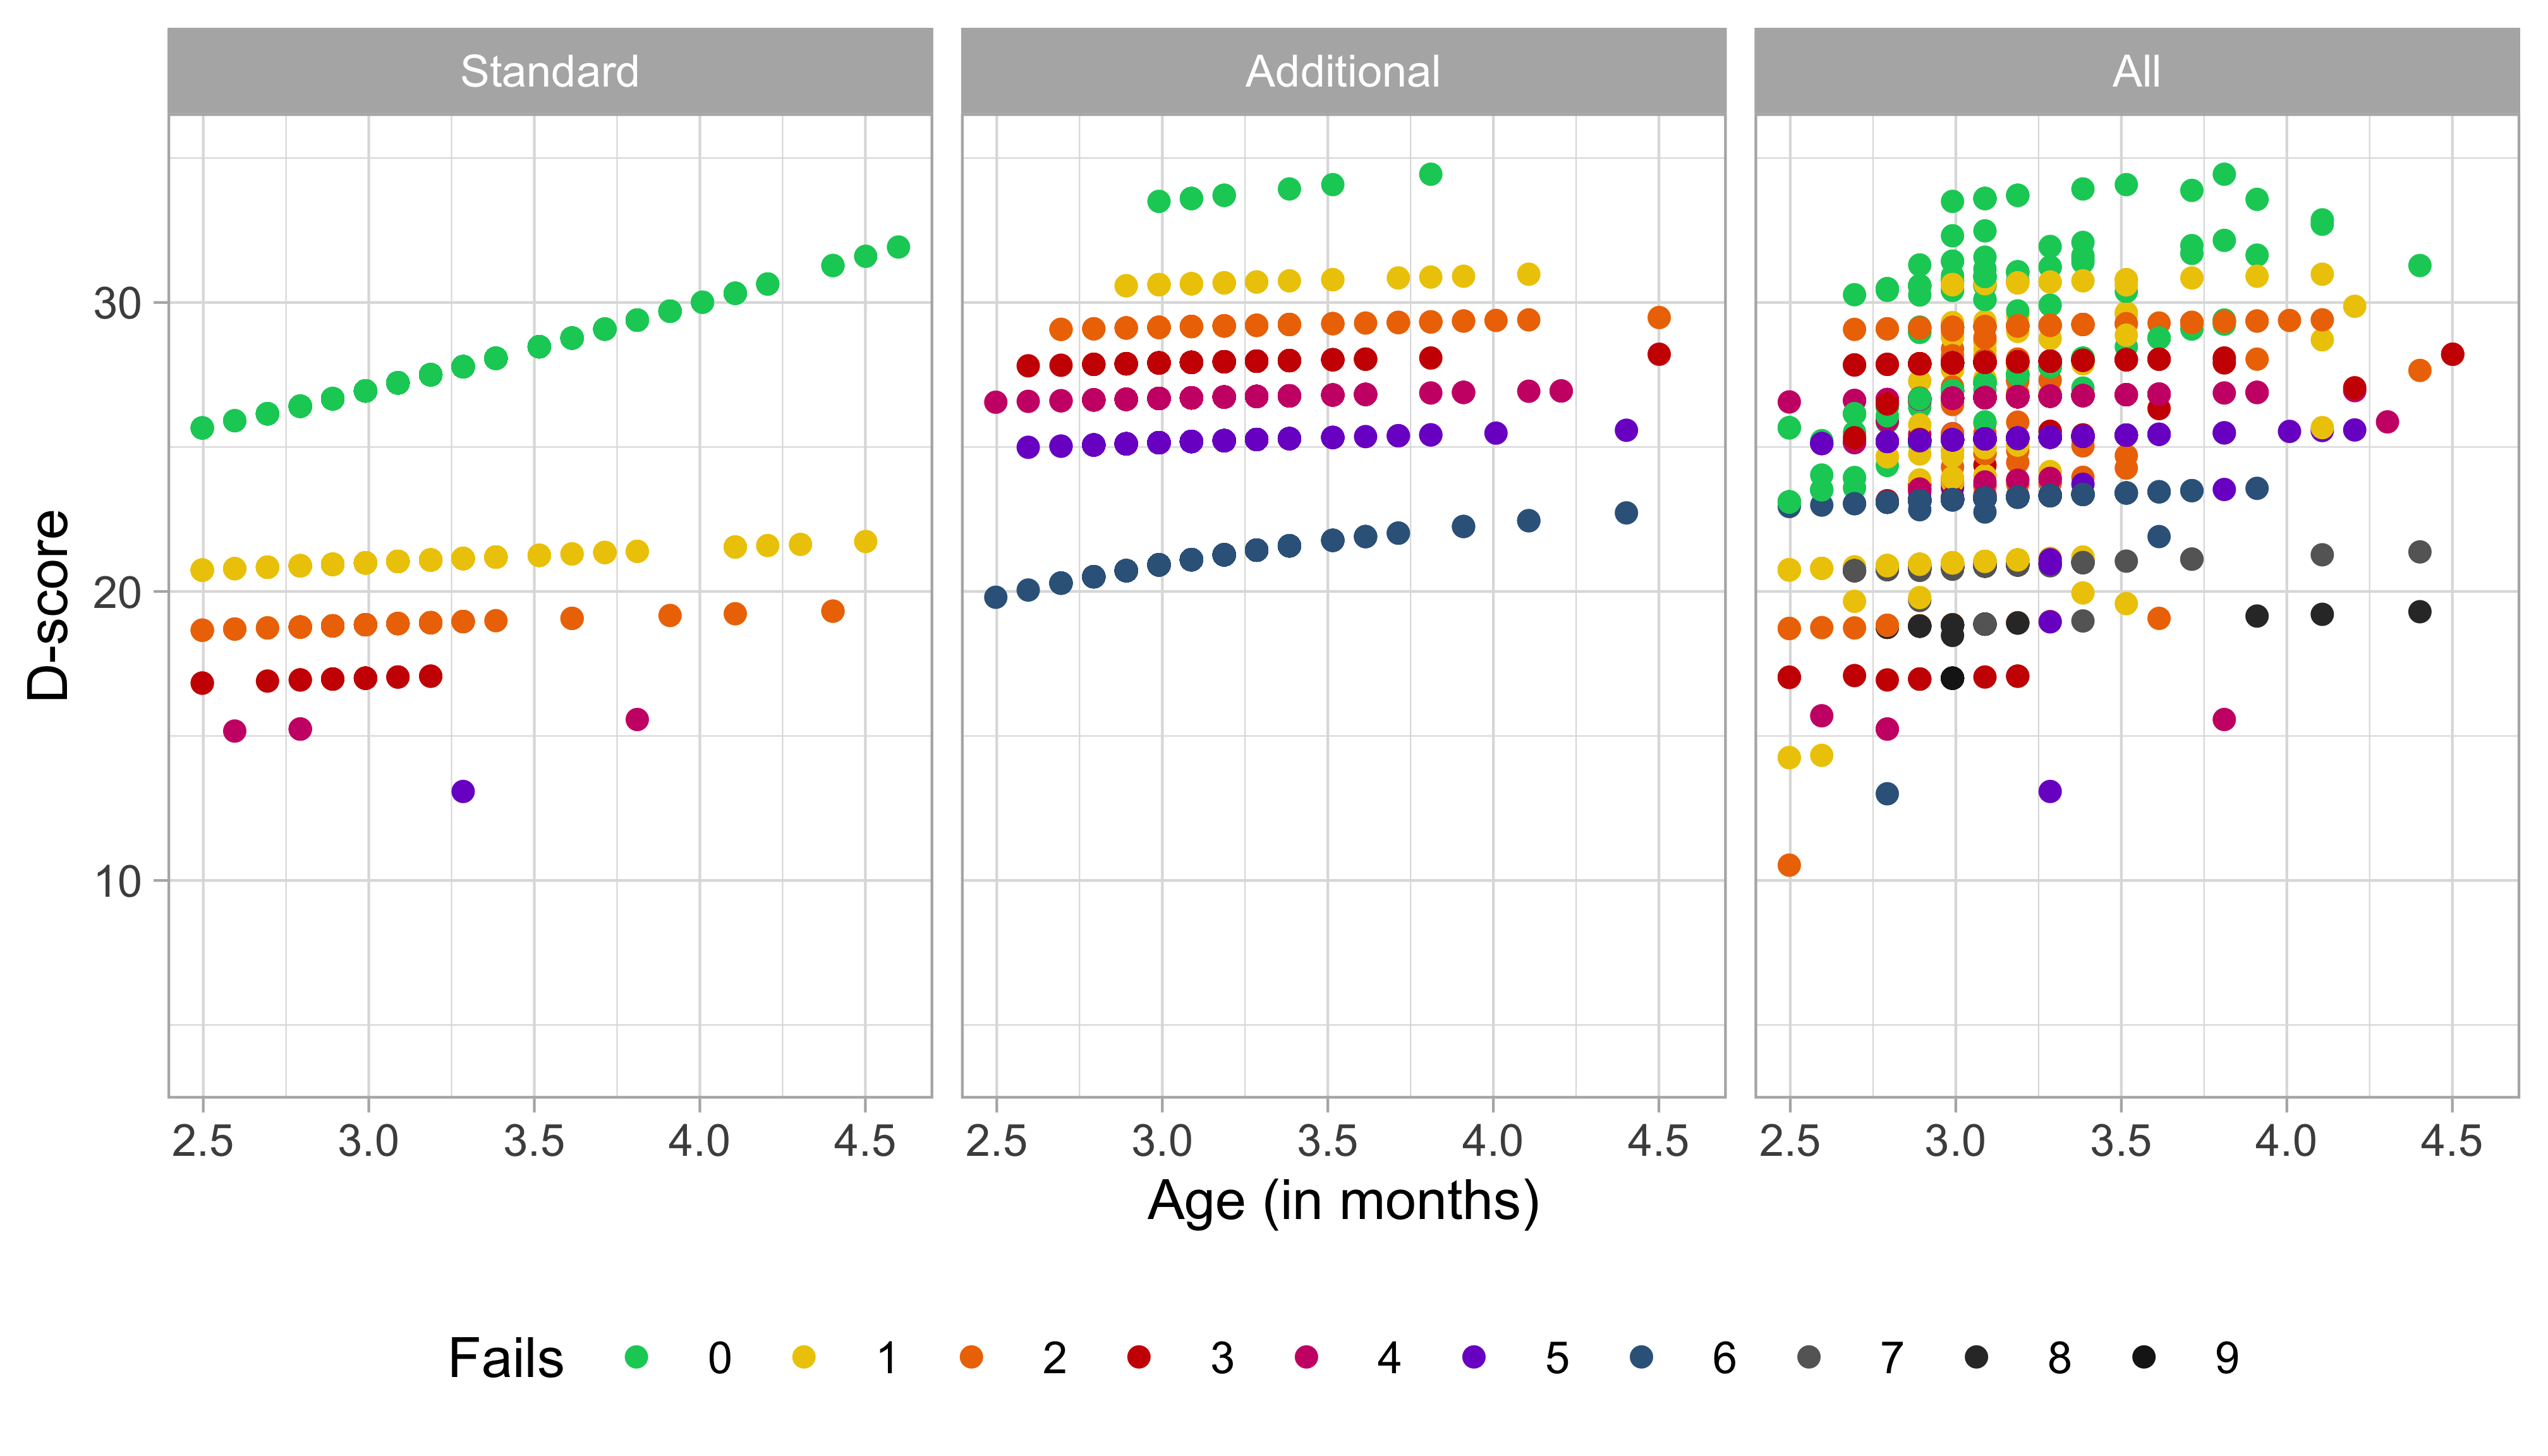
Figure 8.3: Distribution of the D-scores calculated from the standard, additional and all available milestones at month 3. Colors correspond to the number of fails.
Figure 8.3 is the same plot as before, but now for month 3. Compared to Figure 8.2, all points shifted upwards because the children are now one month older.
The additional milestones from month 2 are the standard milestones of month 3. In Figure 8.2, there were at least 11 children (in purple) failed all five additional milestones. One month later, one child has five fails.
8.2.4 Floor and ceiling effects
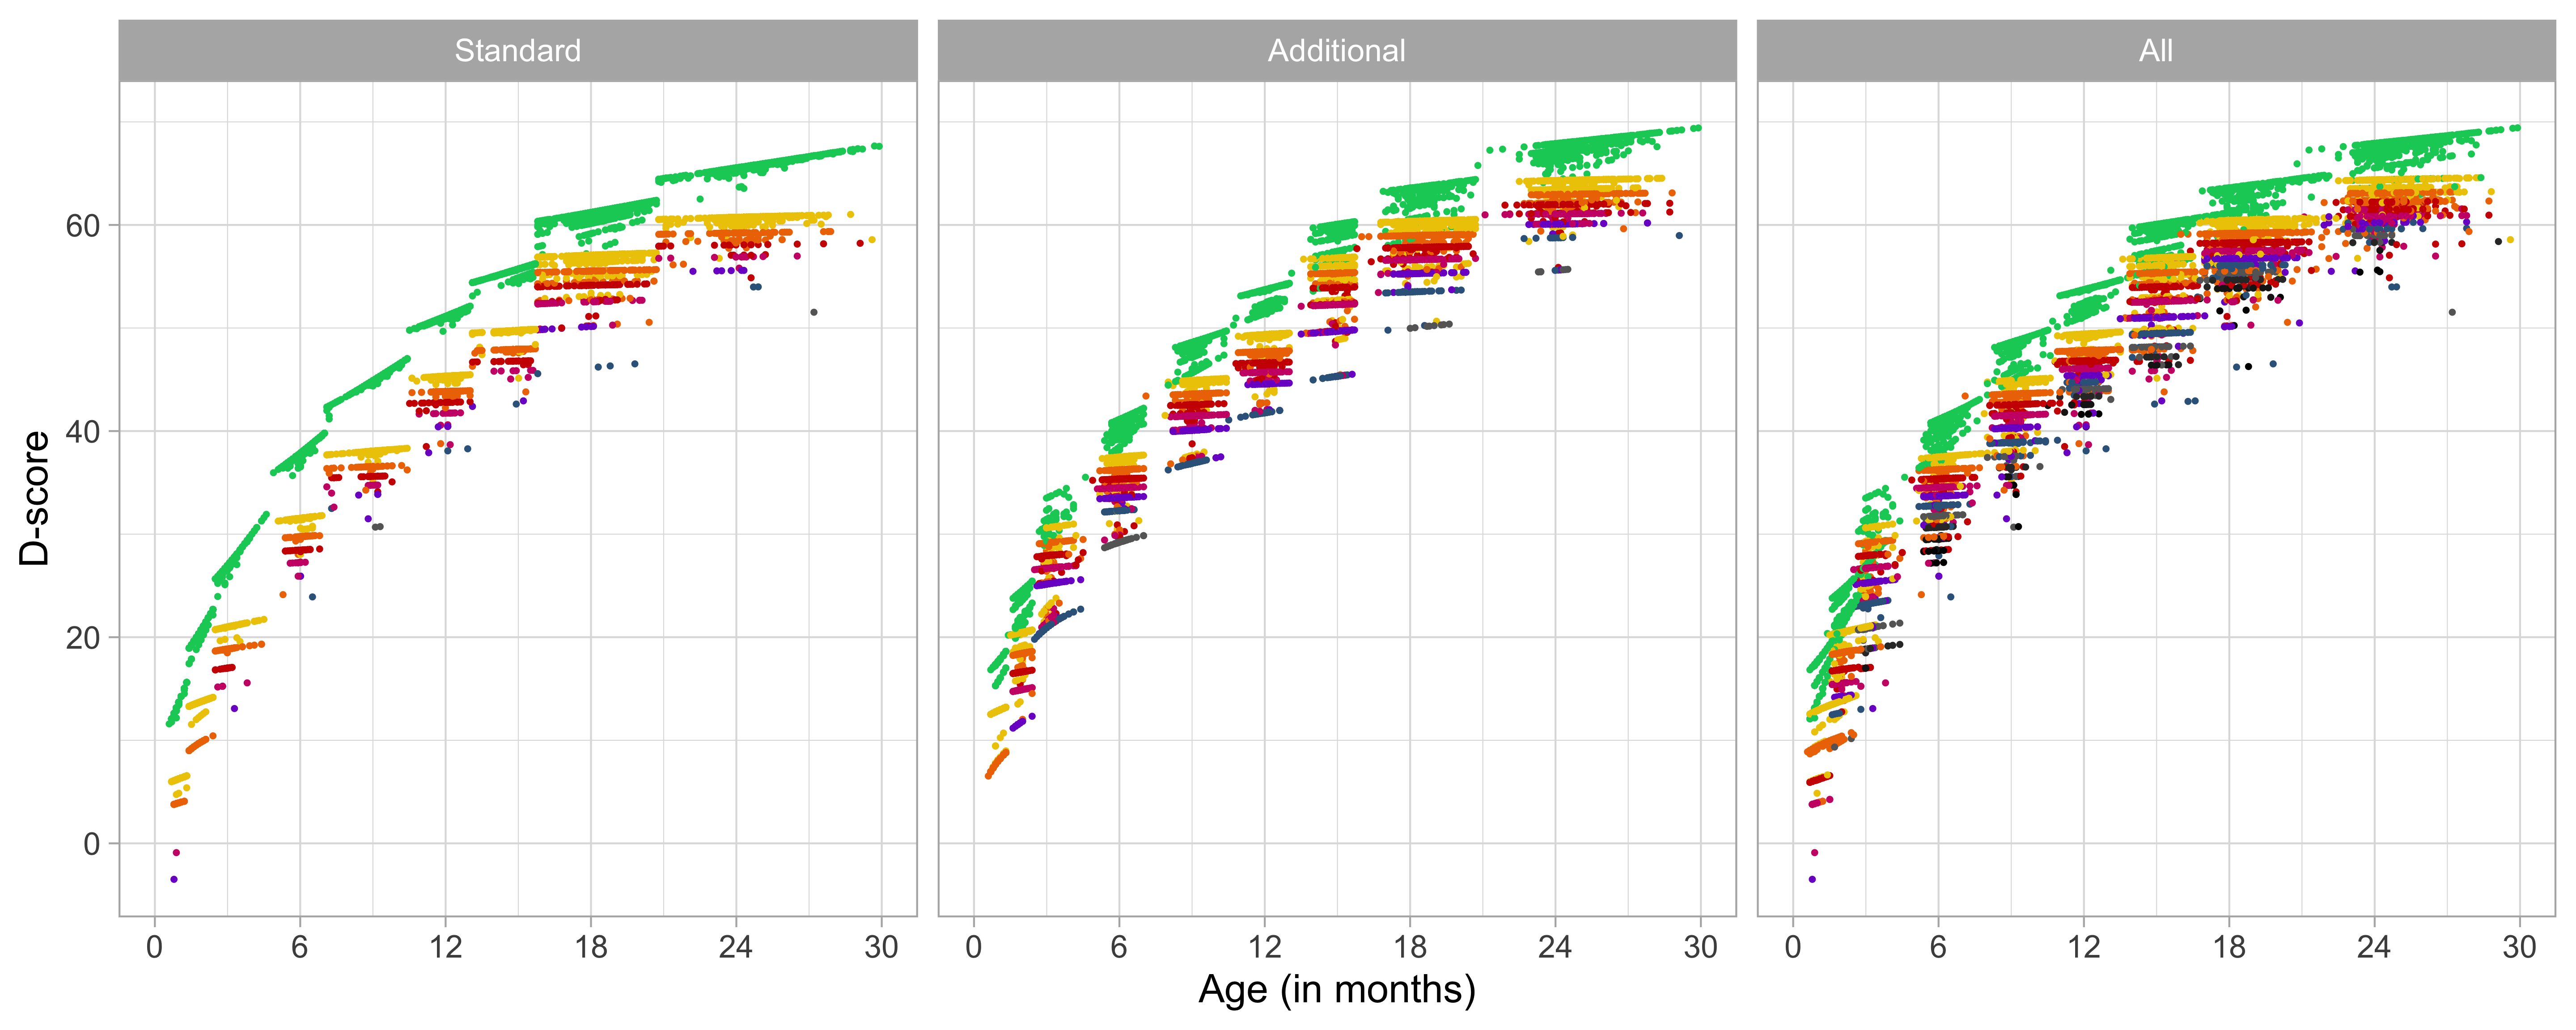
Figure 8.4: D-score by age 0-30 months for standard, additional and all available milestones at each measurement occasion.
Figure 8.4 plot the D-score distribution for all occasions. Some observations:
- Ceiling effect: The ceiling effect (green) is most prominent in the standard set, but is also present in the other two sets. None of the three sets can filter out children with really advanced development. To achieve more precision at the upper end, we would need to include more difficult milestones.
- Floor effect: There are almost no floor effects in the standard and all sets. These sets discriminate well among children with delayed development, which was the designed purpose of the DDI. Note that floor effects are visible in the additional set.
- Average level: All three sets capture the overall relation between age and development. The additional set is quite efficient for measuring average levels development but lacks detail on the extremes.
Figure 8.4 shows that a short test (5-6 milestones) can precisely measure the lower tail of the D-score distribution (standard set) or the middle of the D-score distribution (additional set), but cannot do both at the same time.