5.8 Item information
Item information is a psychometric measure that quantifies the sensitivity of the item to changes in the person’s ability. An item is most sensitive around the D-score value where the PASS probability equals the FAIL probability, which corresponds to the item difficulty (\(\delta_i\)). One unit change around \(\delta_i\) has a large effect on the probability of endorsing, while one unit change far away from \(\delta_i\) has negligible impact. Suppose person A had passing probability \(0.7\) for some item. The information delivered by that item for person A is the product \(0.7 \times (1.0 - 0.7) = 0.21\). Suppose person B has a D-score that coincides with the difficulty level of the item. In that case, the information for B equals \(0.5 \times (1 - 0.5) = 0.25\), the maximum. Likewise, for a person C with high ability, the information could be \(0.98 * 0.02 = 0.02\), so that item carries almost no information for person C.
The information is inversely related to the error of measurement. More information amounts to less measurement error. For each response in the data, we can compute the amount of information it contributed to the model D-score. By summing the information over persons, we obtain a measure of certainty about the difficulty estimate of the item. This sum of information incorporates both the number of administrations and the quality of the match between person abilities and item difficulty.
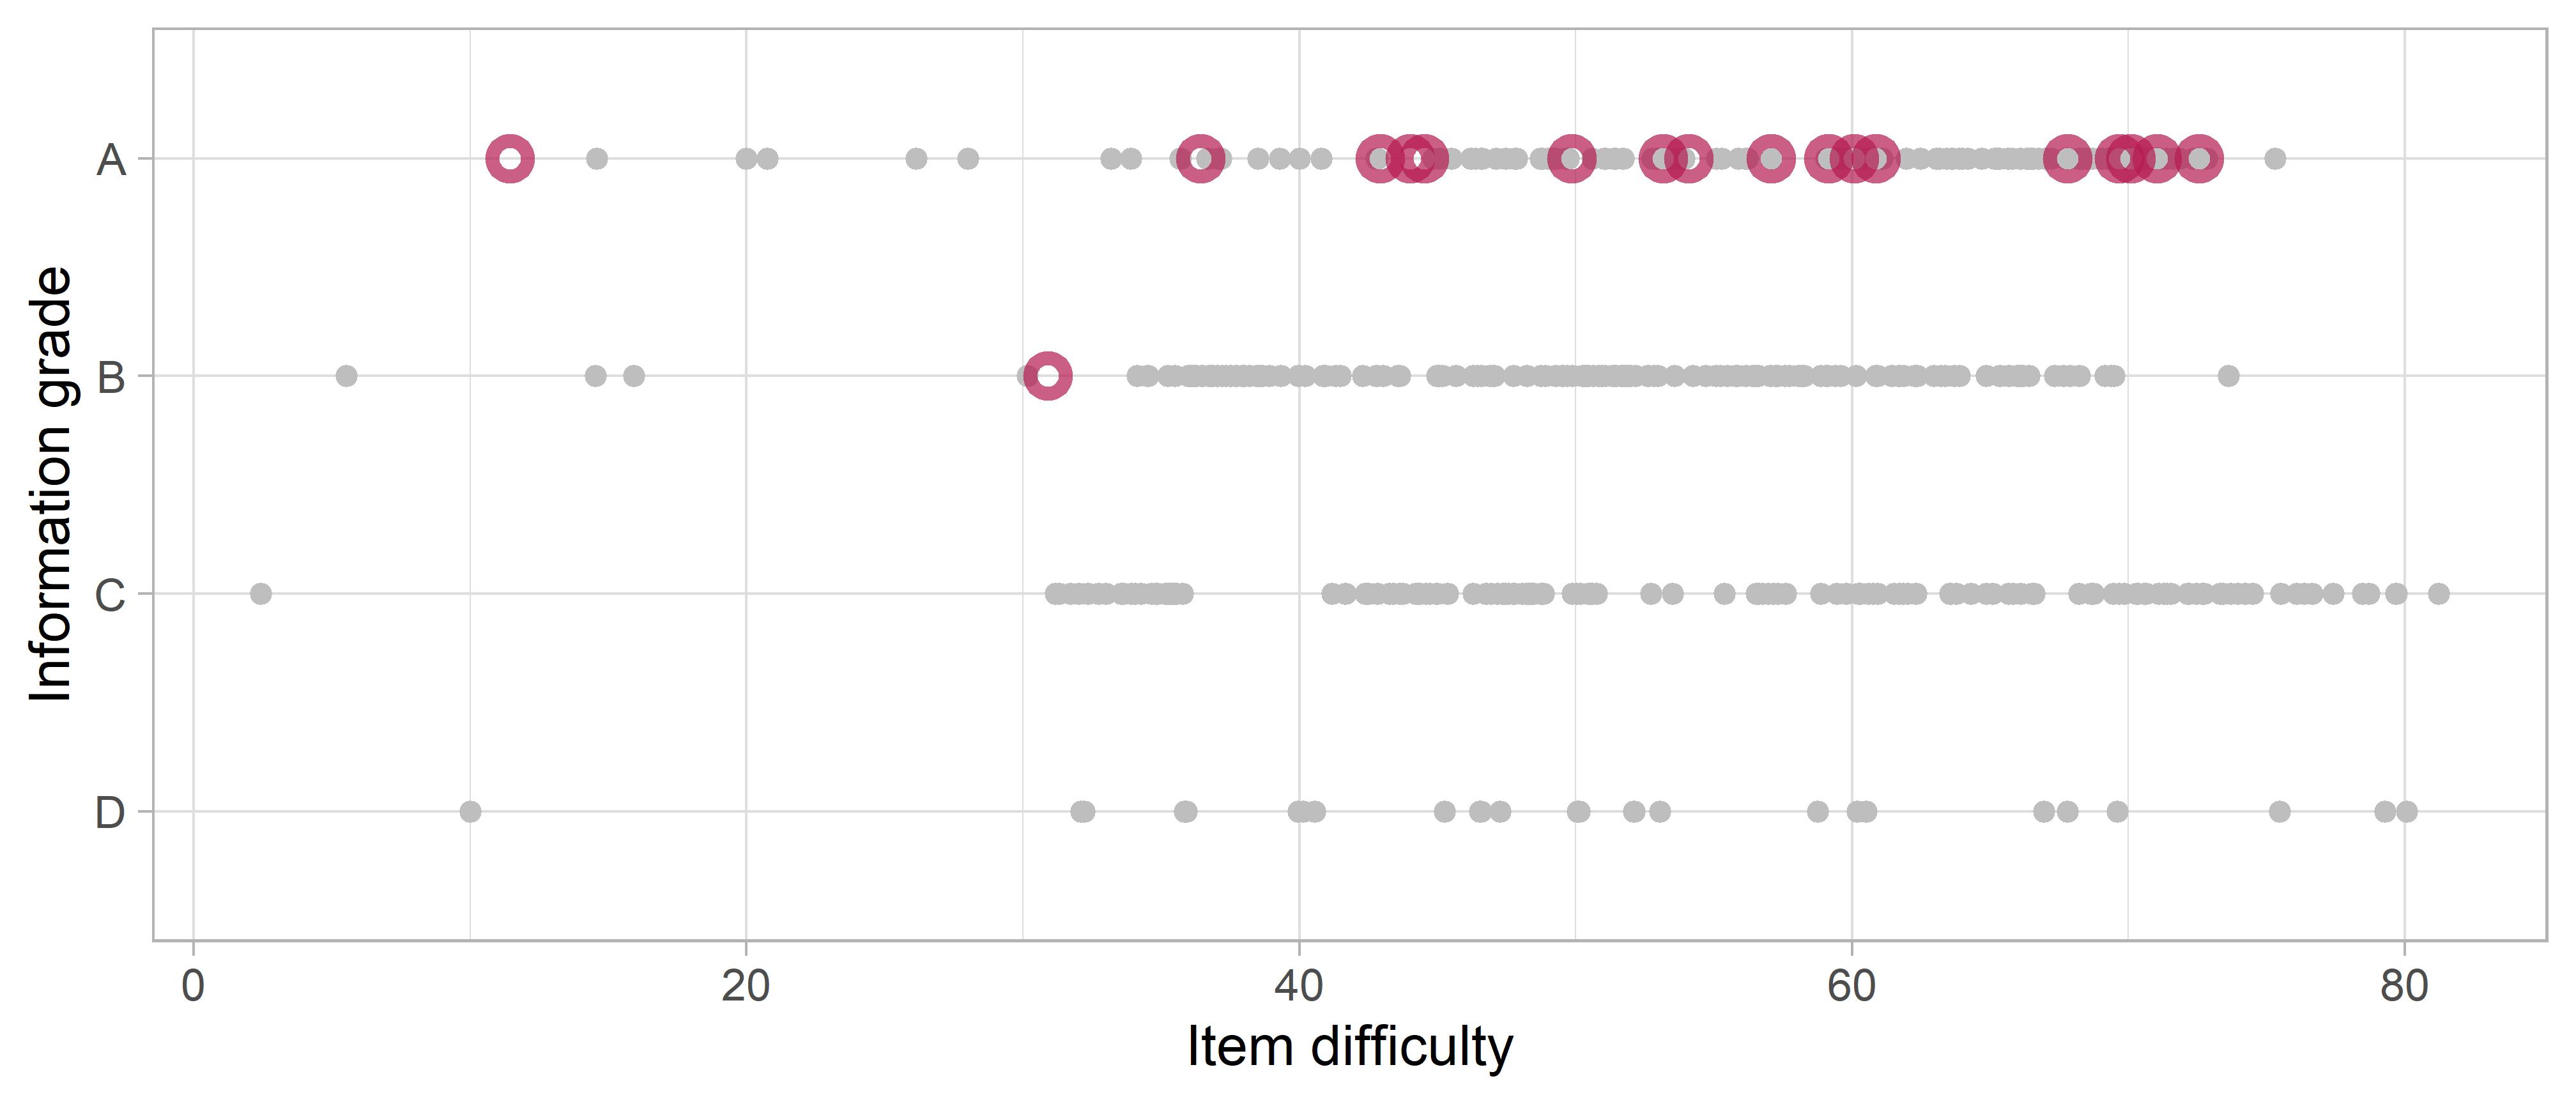
Figure 5.7: Item information grade by item difficulty for the final model
Figure 5.7 displays the summed information for each item, divided into four grades: A(best) to D (worst). The information grade measures the stability of the difficulty estimate. Most items receive grades higher than C. In total, 30 milestones have grade D. Adding these items to future studies may yield important additional information.
The red circles indicate active equate groups. Most have grade A, so we have a lot of information about the items that form the active equate groups. Table 5.2 displays more detailed information for the active equate groups. The sample sizes are reasonably large. Many information statistics are well is above 100; the criterion for Grade A. The interpretation of this criterion is as follows. Suppose that we obtain a sample of 400 persons who are all perfectly calibrated to the item of interest. In that case, the information for that item will be equal to 100.
| Equate group | Difficulty | Sample Size | Information | Grade |
|---|---|---|---|---|
| EXP2 | 11.44 | 3608 | 162.32846 | A |
| REC6 | 30.90 | 5428 | 95.39963 | B |
| GM25 | 36.43 | 6380 | 470.62671 | A |
| FM26 | 42.93 | 4155 | 296.78327 | A |
| GM35 | 44.01 | 5522 | 356.04417 | A |
| COG36 | 44.53 | 7912 | 230.02909 | A |
| GM42 | 49.86 | 5953 | 327.74297 | A |
| FM31 | 53.17 | 10991 | 731.65850 | A |
| COG55 | 54.08 | 5647 | 420.34928 | A |
| FM72 | 57.07 | 5430 | 253.63655 | A |
| EXP26 | 59.15 | 9119 | 578.79355 | A |
| SA1 | 60.08 | 3363 | 172.10653 | A |
| FM38 | 60.87 | 10236 | 491.68110 | A |
| FM52 | 67.80 | 13487 | 1159.93870 | A |
| FM43 | 69.66 | 15765 | 1563.88651 | A |
| GM60 | 70.09 | 9519 | 1070.60909 | A |
| REC40 | 71.04 | 10393 | 1182.90580 | A |
| FM61 | 72.56 | 10612 | 945.86689 | A |